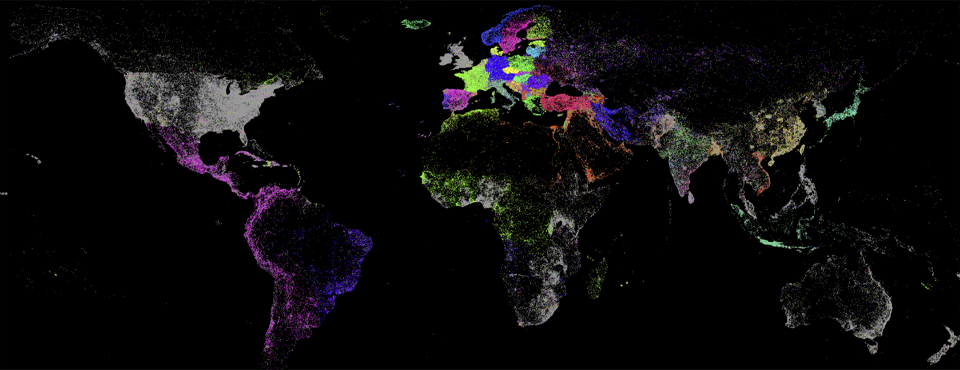
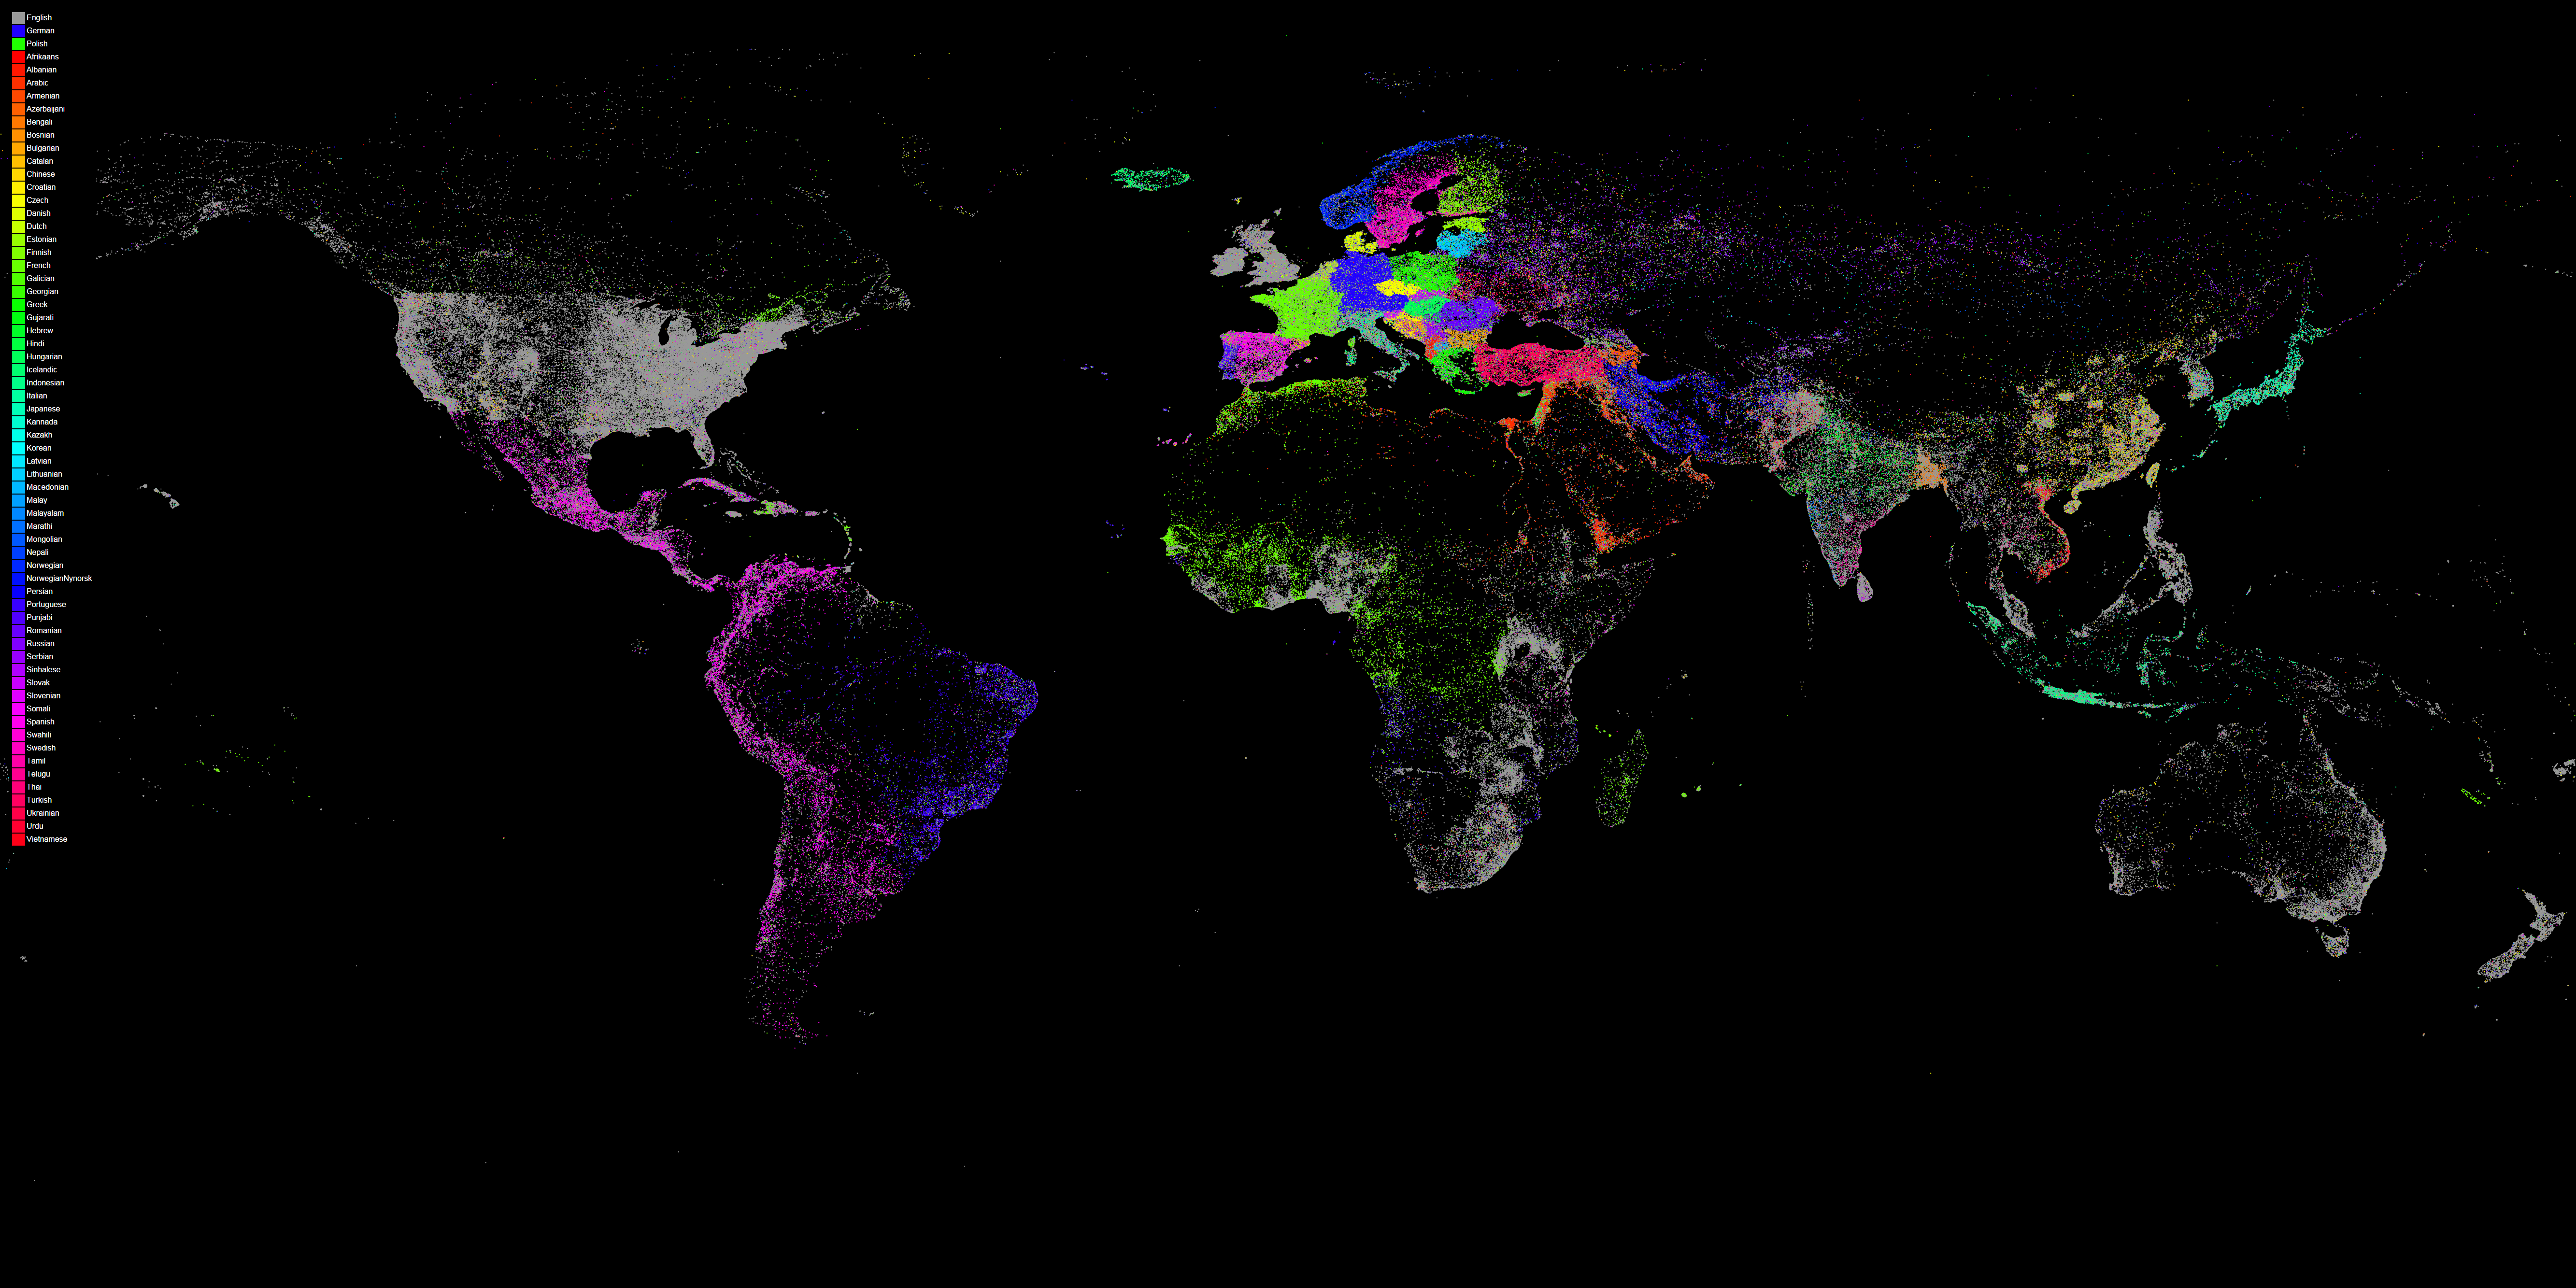
We're excited to unveil a new visualization that showcases the power of GDELT's realtime machine translation of the world's local news media in 65 languages! The map below is similar to the one unveiled earlier today, and displays a dot at every location mentioned one or more times in theGDELT 2.0 Global Knowledge Graph from February 19, 2015 through July 11, 2015 (dots are not sized by number of mentions so a single dot could represent one mention or millions of mentions).
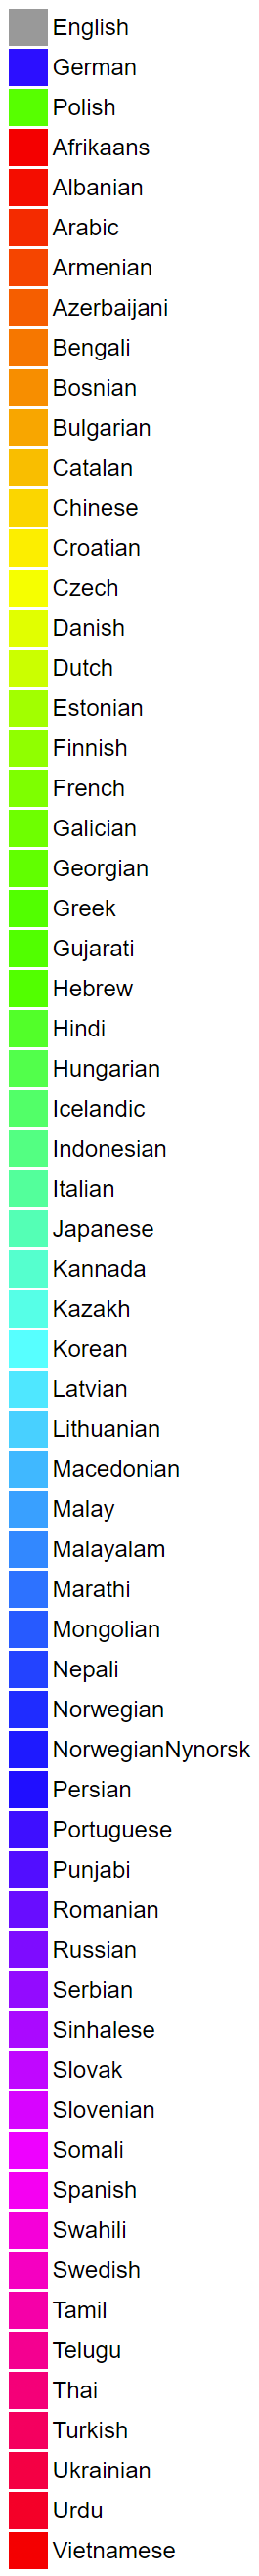
The difference this time is that each dot is colored by the most common language of news coverage mentioning that location. In other words, for each location, the language of every article mentioning that location is tallied up and the most common language is selected as the color of that location. The legend at the top left of the map lists all of the languages and their respective colors. Three languages (English, German, and Polish) are displayed out of order at the top of the map due to the need to select special colors for them due to their close geographic proximity on the map to other languages of similar colors otherwise.
What is so striking about the map below is just how little of the world is covered primarily in English by the news media. A cursory glance confirms that the world is a vibrant tapestry of languages and that to penetrate into local news and perspectives, one must utilize local news in local languages, making use of mass machine translation to process it all. Looking only at English-language Western outlets simply is not sufficient.
Technical Details
For those interested in creating their own version of this map, the procedure is similar to the one used to create the basic GDELT geographic footprint map. The following SQL query, drawn from the BigQuery + GKG 2.0 sample queries guide, searches the GKG 2.0 table in Google BigQuery, parsing the V2Locations field and rounding each coordinate to the nearest two decimals, grouping the results further by language:
SELECT lat, long, lang, COUNT(*) as numarticles
FROM (
select
ROUND(FLOAT(REGEXP_EXTRACT(SPLIT(V2Locations,';'),r'^[2-5]#.*?#.*?#.*?#.*?#(.*?)#.*?#')), 2) as lat,
ROUND(FLOAT(REGEXP_EXTRACT(SPLIT(V2Locations,';'),r'^[2-5]#.*?#.*?#.*?#.*?#.*?#(.*?)#')), 2) as long,
REGEXP_EXTRACT(TranslationInfo, 'srclc:(.*?);') as lang
from [gdelt-bq:gdeltv2.gkg]
)
where lat is not null and long is not null
group by lat,long, lang
Save the results to a new export table in BigQuery (it should only take around 20 seconds to complete!), export as a CSV file to Google Cloud Storage, and then download to your local computer and save it as "gkg2all_roundedtwodec.csv".
Next, we're going to run a PERL script that collapses the results based on the most common language of coverage of each location. Download "computetoplangbyloc.pl" and run in the same directory as the "gkg2all_roundedtwodec.csv" file you downloaded above. It will run for a few moments and output a new "LOCSBYLANGS.TXT" file that we will map in the next step.
Now, download the latest version of the free open source GraphViz package. Then download the "COLORLOOKUP.TXT" color map (generated in part using the R command "rainbow(65)" to generate the color scale), "colorpaletteforlang.html" and "colorpaletteforlang-white.html" color palette legends (or their prerendered black and white PNG versions), "bqcsvtomap_withlang.pl" PERL script and place them all in the same directory as the "LOCSBYLANGS.TXT" file from above. Run the "bqcsvtomap_withlang.pl" PERL script like "./bqcsvtomap_withlang.pl LOCSBYLANGS.TXT". The PERL script reprojects from plate carree to GraphViz' coordinate space, generates a .DOT GraphViz file, and then uses the GraphViz rasterizer to generate the final map file. It may take a fair amount of RAM and processing time to generate the final visualization, but after a few minutes you should have a final map like the one above, measuring 5333 x 2667 pixels. Then, if you'd like to add the legend, open the "colorpaletteforlang.html" HTML page in your browser, screen capture it, and then paste it on top of the map using Photoshop or similar image editing software.
Congratulations, you have now mapped the linguistic geography of GDELT over the past five months!