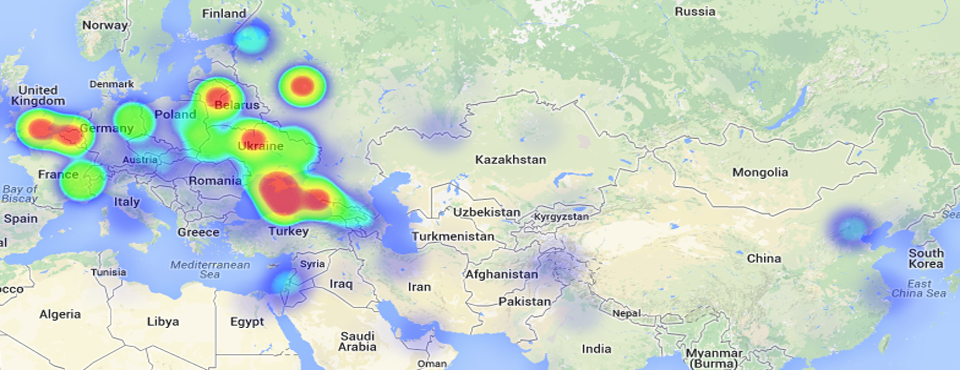
One of the most-requested features for the new GDELT Analytics Service has been the addition of GIS-friendly export file formats and especially creation of a “heatmap” visualization capability. Thus, without further ado we present the new GDELT Event and Global Knowledge Graph Heatmapper tools!
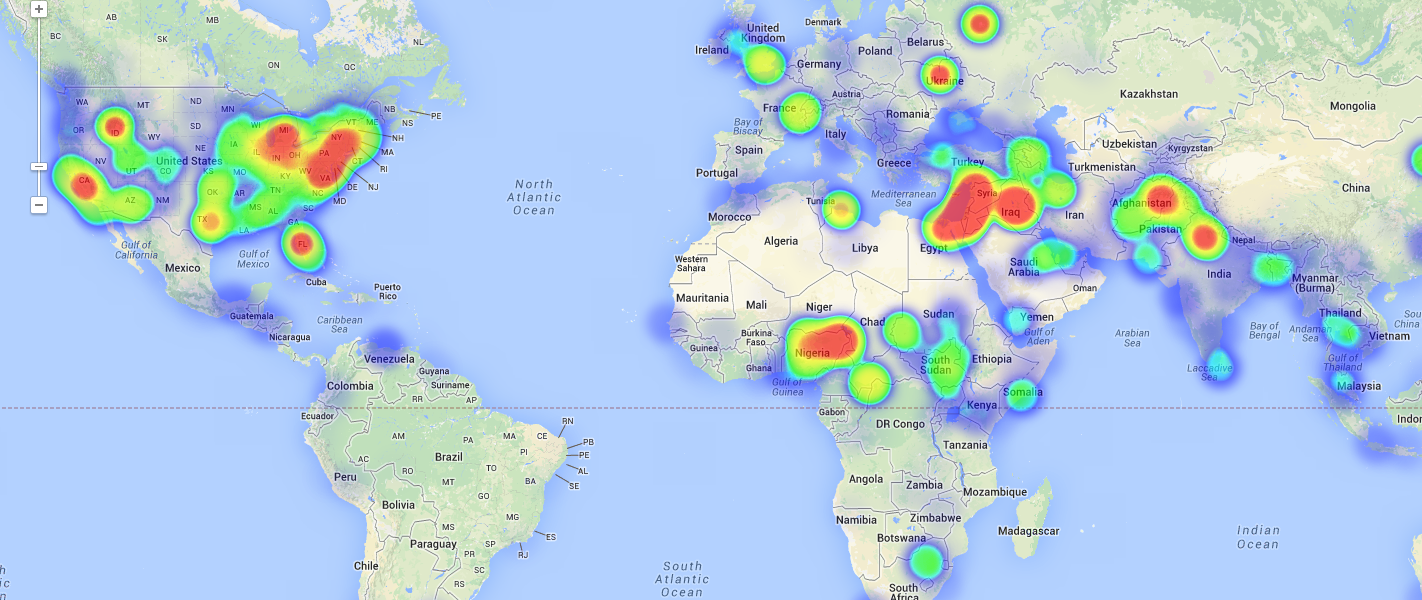
(Click the image above to view the interactive heatmap).
For event data, this service allows you to rapidly examine the geographic profile of events matching your query and explore possible spatial patterns. For the Global Knowledge Graph, you can examine the changing spatial profile of a political leader, the geographic context of a location, or trace the evolution of a theme over space.
A live interactive heatmap visualization is created that runs in your browser and allows you to interactively zoom into a country or region to see finer and finer detail. Uniquely, you can also use a slider tool in the upper-left of the heatmap visualization to interactively adjust the upper bound threshold of the heatmap. In most cases there will be a small set of locations that have so many more events that they simply overwhelm the rest of the heatmap and make it impossible to see finer detail elsewhere in the world. By adjusting this slider you can essentially set all values higher than a certain amount to be collapsed, which basically eliminates them and refocuses the heatmap on lower volumes, bringing out finer detail.
A .CSV file is also created for each heatmap. This comma-separated file contains a list of all latitude/longitude pairs and the number of matching events/namesets/articles at that location. This allows you to import the geographic information into professional GIS software like ESRI’s ArcMap to perform more sophisticated geographic visualizations and analyses. In addition, the Global Knowledge Graph .CSV file includes an additional column that records the average “tone” (from extremely positive to extremely negative) of all matching records for each location, making it possible to create emotional heatmaps with the right software.
Try it for yourself with the Event Heatmapper or Global Knowledge Graph Heatmapper from the GDELT Analysis Service!
Happy mapping!