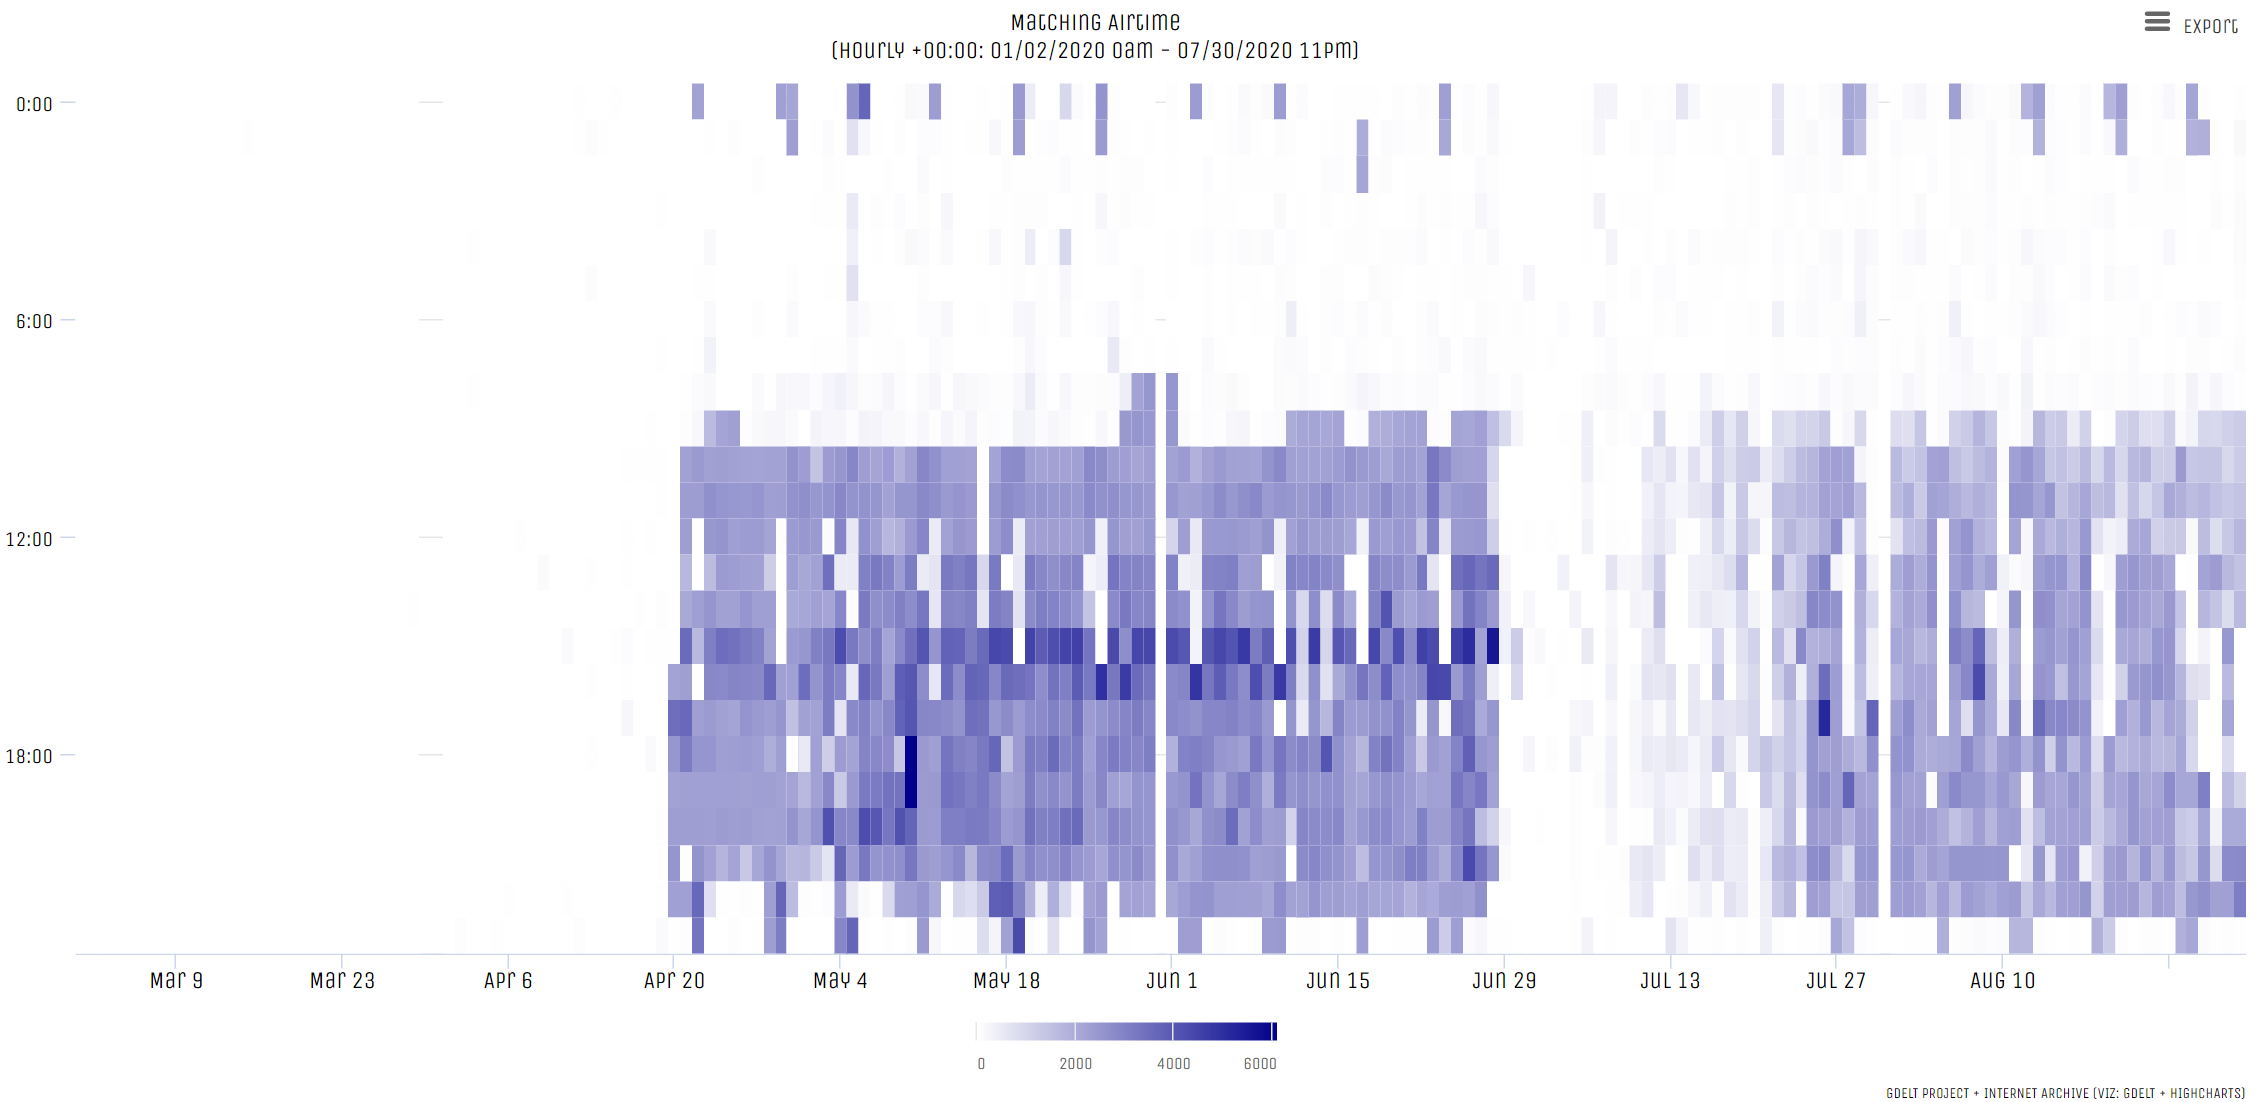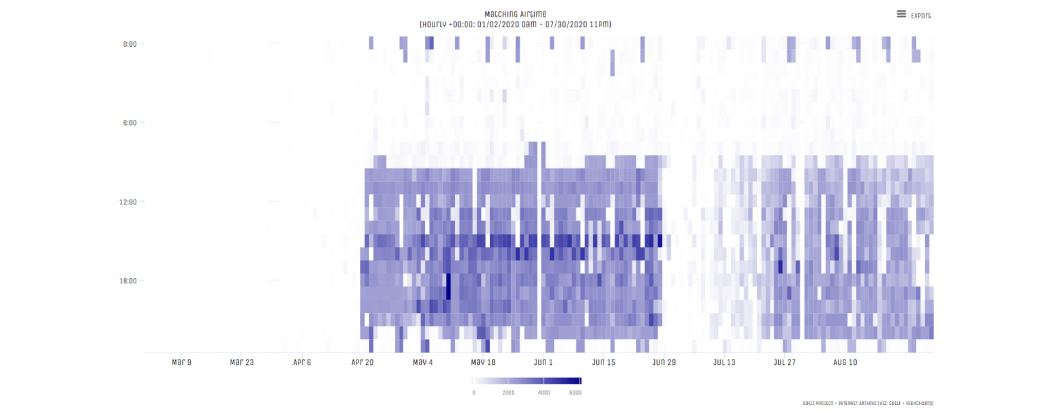
Our new heatmap visualization is now available! This display shows an hourly timeline of total airtime seconds matching the query, rapidly pinpointing hourly trends, where the X axis is days and Y axis is hours from 0 to 23. Each cell is color-coded from white (0) to dark blue (maximum value). Note that this visualization is very computationally expensive and thus may take several seconds or longer to return.
Learn more about the TV AI 2.0 API!