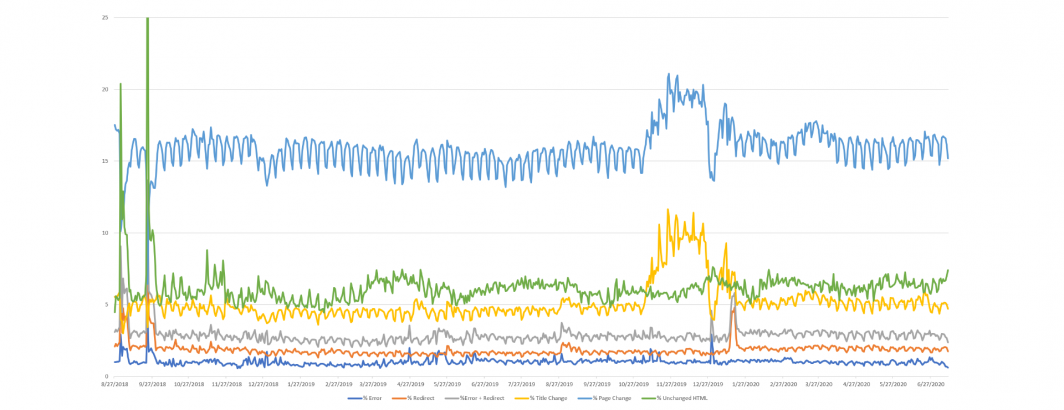
As the Global Difference Graph (GDG) reaches 1.3 billion records, the timeline below shows the percentage of unique URLs recrawled each day (both the 24 hour and one-week recrawls) that fall into each of the categories below. Overall, most of the statistics below appear remarkably stable, suggesting they represent long-term trends of the global news landscape.
Computing individual statistics from the timeline below is as simple as:
select Day, sum(NumArts) NumArts, sum(Changed) Changed, ( sum(Changed) / sum(NumArts) )*100 Perc from (
 ( SELECT DATE( fetchdate_check ) Day, count(distinct page_url) NumArts, 0 Changed FROM `gdelt-bq.gdeltv2.gdg_partitioned` group by Day order by Day asc )
UNION ALL
 ( SELECT DATE( fetchdate_check ) Day, 0 NumArts, count(distinct page_url) Changed FROM `gdelt-bq.gdeltv2.gdg_partitioned` WHERE (status='HTTP_ERROR' or status='HTTP_REDIRECT') group by Day order by Day asc )
) group by Day order by Day asc
Below is the final timeline.
