What does it look like to apply LMMs like Gemini at scale? Specifically, given that "tokens" are the central currency of the modern AI landscape, broken into "prompt", "thinking" and "candidate" tokens and bear only a loose relationship to words and characters, let's look at some basic statistics from a small batch run of 10,000 English language television news broadcasts totaling 416M total prompt tokens processed through Gemini 2.5 Flash Thinking yielding 116M output tokens and 125M thinking tokens to see a glimpse of how all of these statistics work in real life. Interestingly, we see that for this specific workload, thinking takes up around half of the output for 75% of the broadcasts.
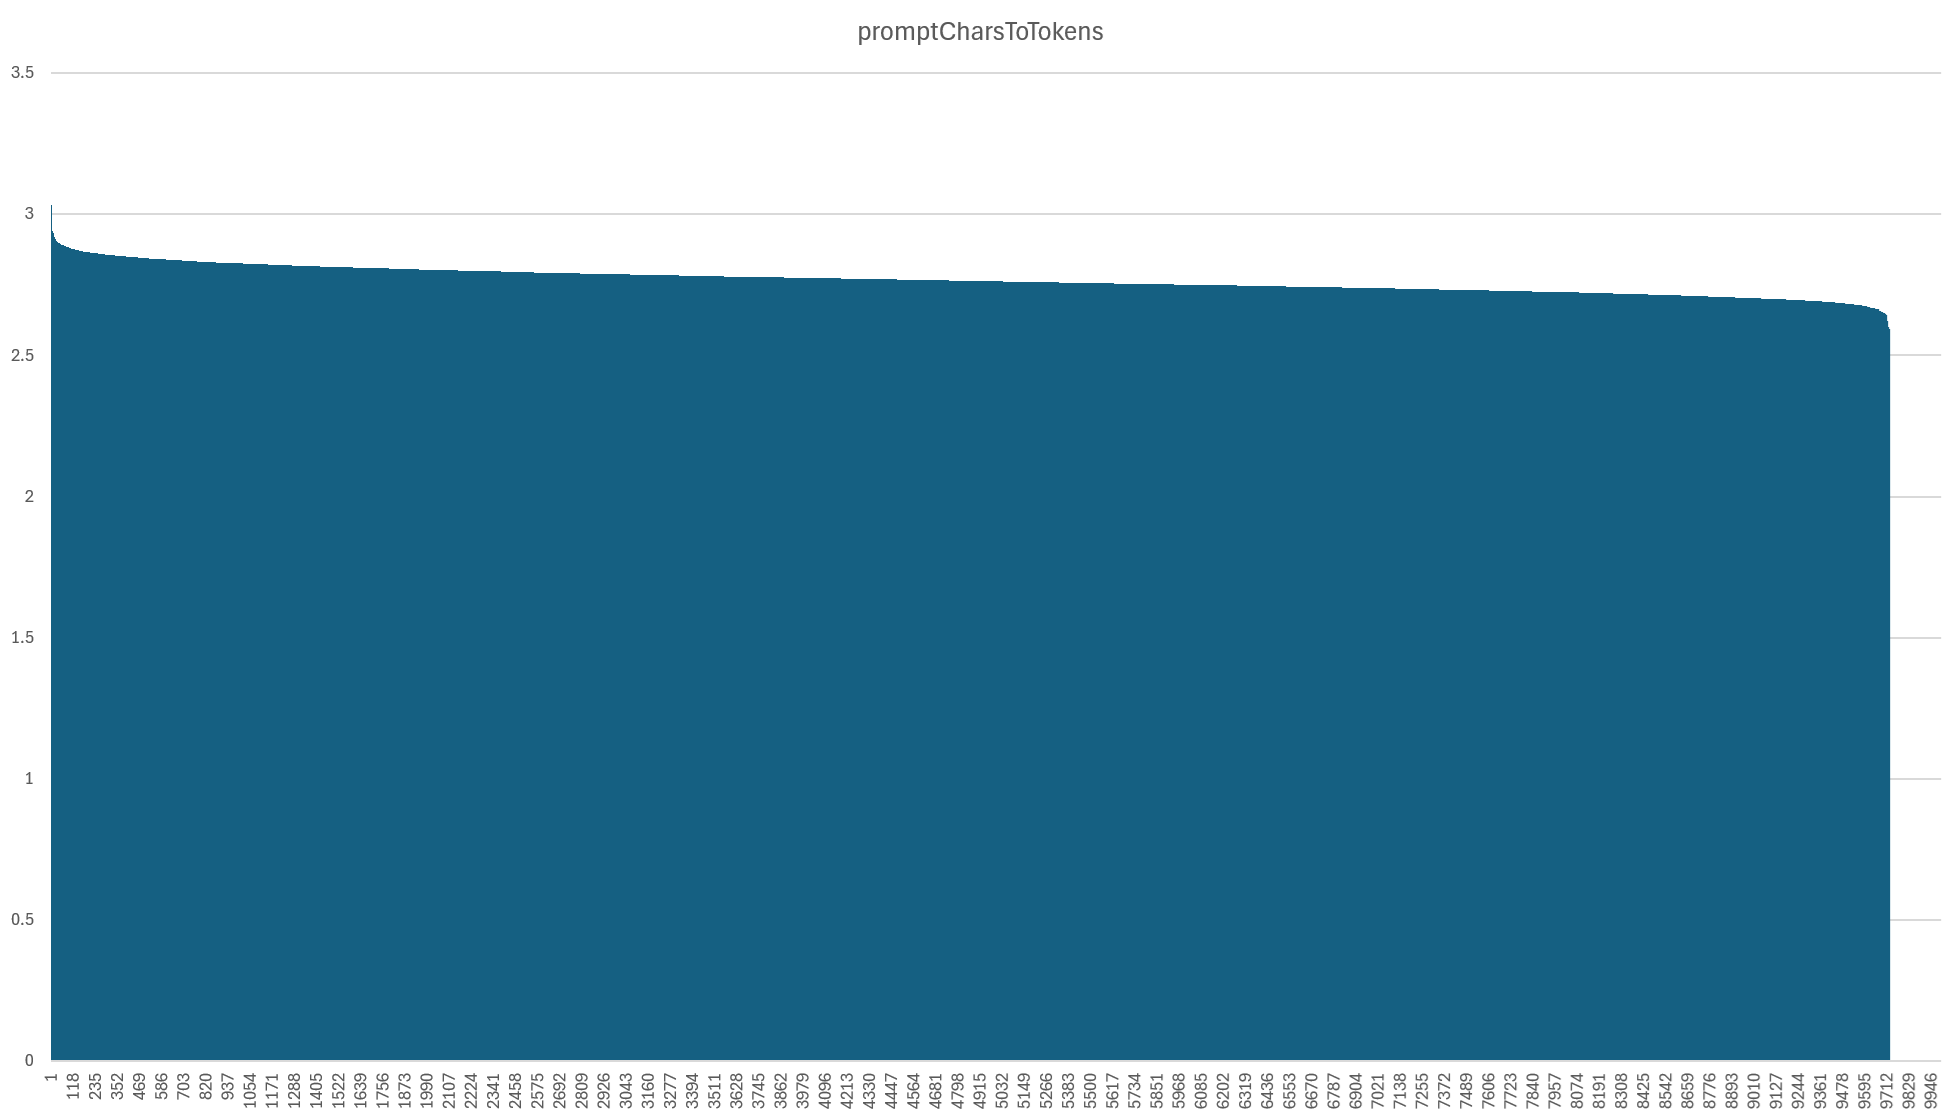
Our sample batch consisted of 10,000 input broadcasts totaling 416M prompt tokens. Using the more traditional concept of "words" and "characters", the raw prompt text input to Gemini consisted of 110.4M words across 1.148B characters. That works out to an average of 2.76 characters per "token" with a standard deviation of 0.046, as seen in the graph below. The input consisted of English text embedded in JSON markup and this conversion ratio was remarkably consistent overall. Characters and tokens are correlated at r=0.999 and words and tokens at 0.997. This is one of the most important direct factors that influences the cost of using LMMs: the conversion of input characters to "tokens".
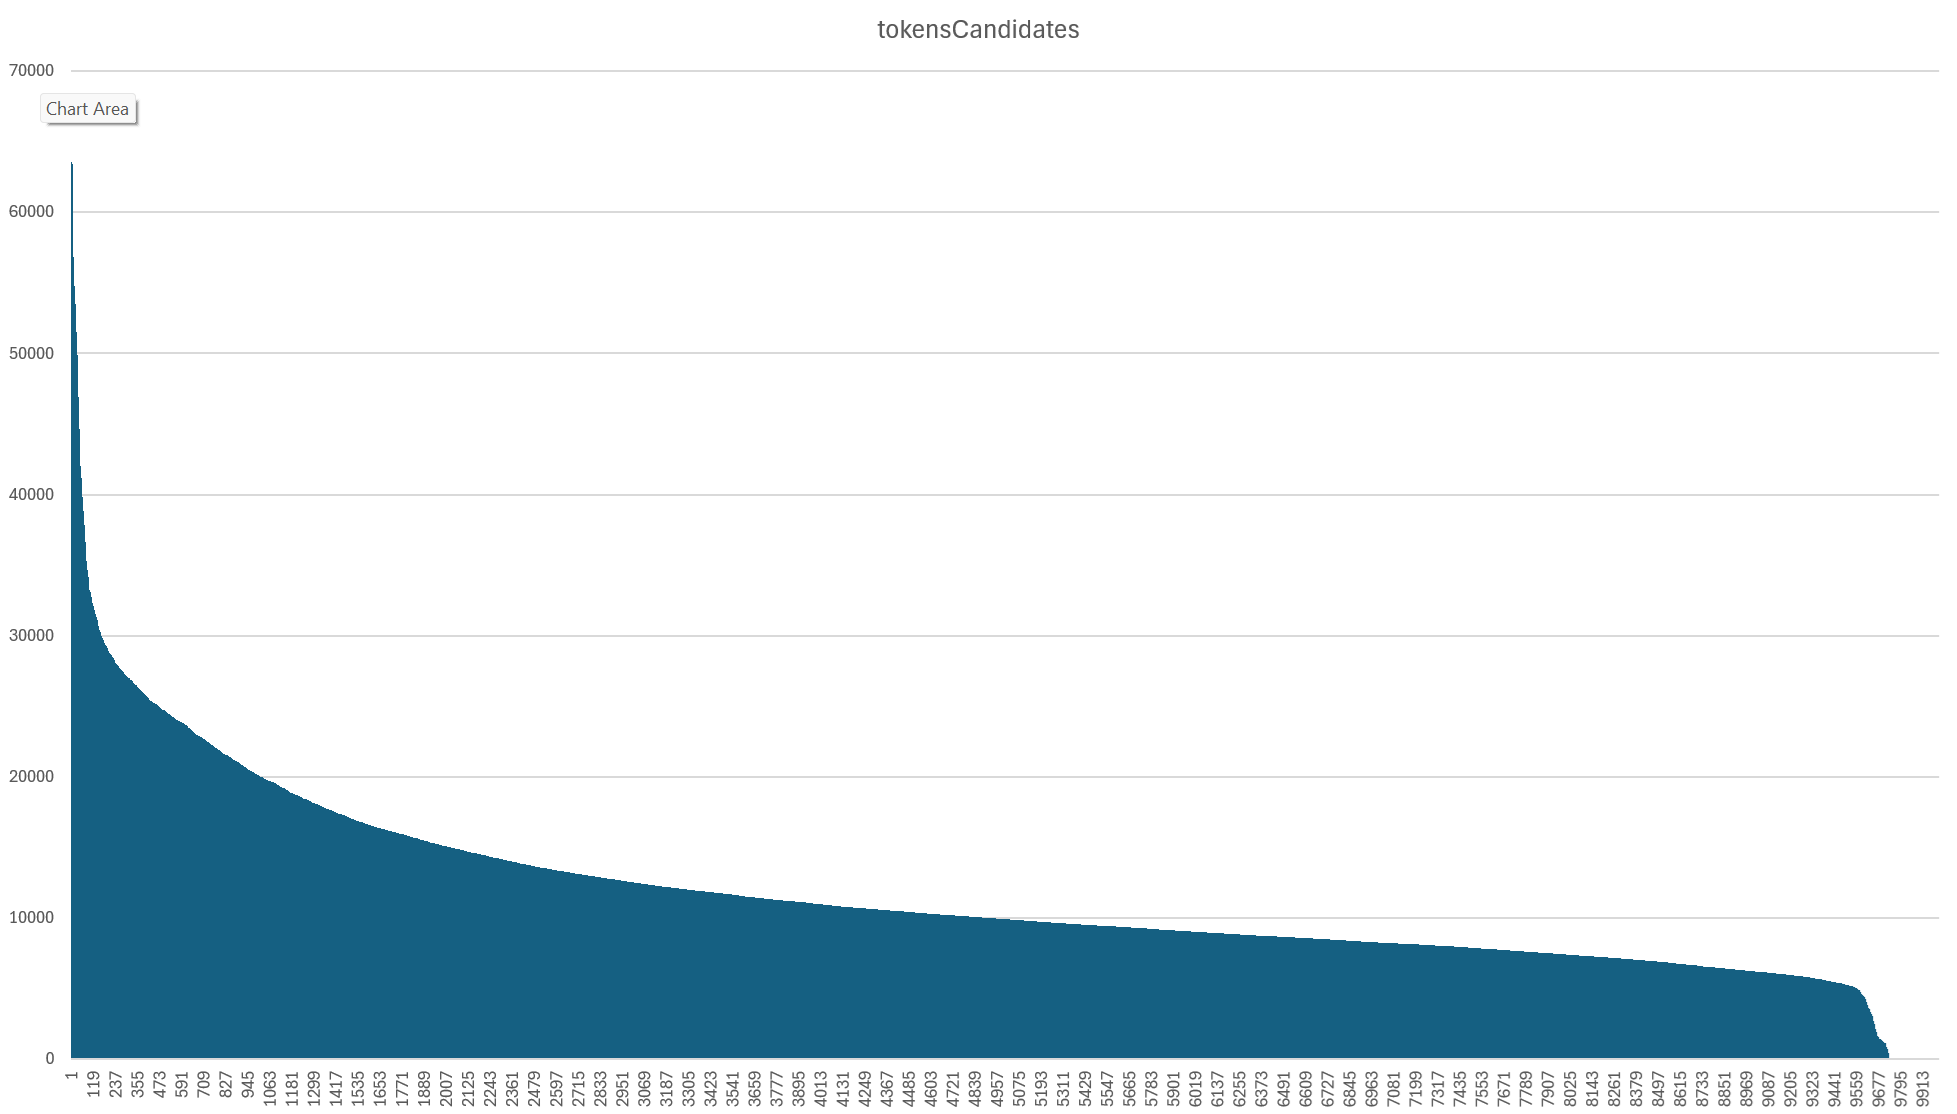
Those 416M prompt tokens yielded 116M output tokens (called "candidate" tokens in Gemini parlance). Of our 10,000 input broadcasts, 511 failed with a MAX_TOKENS error. While Gemini 2.5 supports up to 1 million input tokens, it is limited to just 65K output tokens. Given the rich complexity of this specific set of input broadcasts and the amount of requested output (story segmentation, keywords, locations, emotions, frame and narrrative analysis, etc), a small percentage of broadcasts can hit that maximum. This suggests that for some small percentage of broadcasts we will need to split them into smaller chunks for story segmentation to keep their outputs under this maximum. Overall, though, our workflow matches the traditional LMM workflow: large input (an entire broadcast), much smaller output (just an index of shows and their metadata). In our specific use case (creating an index of stories), there is not expected to be an outsized correlation of input to output size, since long broadcasts can cover many stories or just one or two, but in this particular batch input and output tokens were correlated at r=0.785.
One of the most unpredictable elements of modern LMMs is the cost of their "reasoning" stage. Today's reasoning models essentially "think out loud" by generating a special kind of output token called a thought token. These "thinking" tokens count towards Gemini's 65K token output limit just like normal output tokens that are returned to the user ("thought summaries" return a high-level overview of this thinking process but not the raw thinking workflow). In other words, for Gemini 2.5 thinking models, thinking tokens not visible to the user are combined with output tokens returned to the user when determining the total "output" tokens. This means that if a model consumes excessive thinking tokens, it may not have sufficient output tokens remaining in the 65K limit and thus may error with MAX_TOKENS.
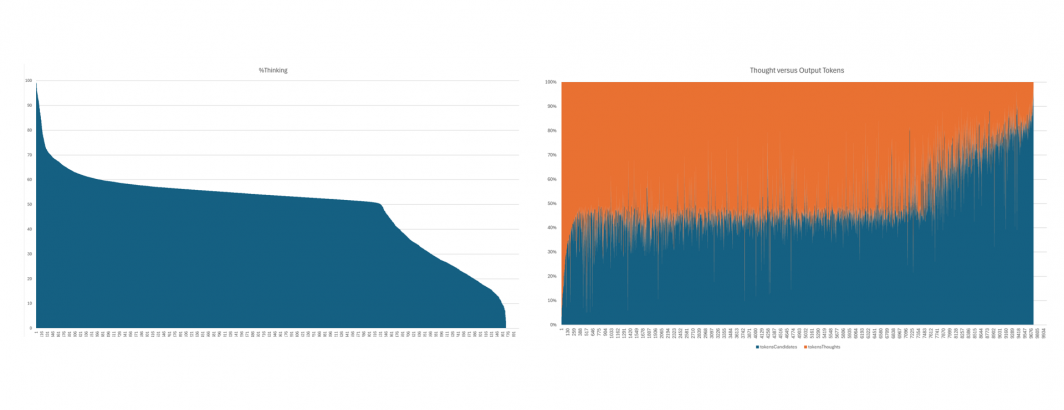
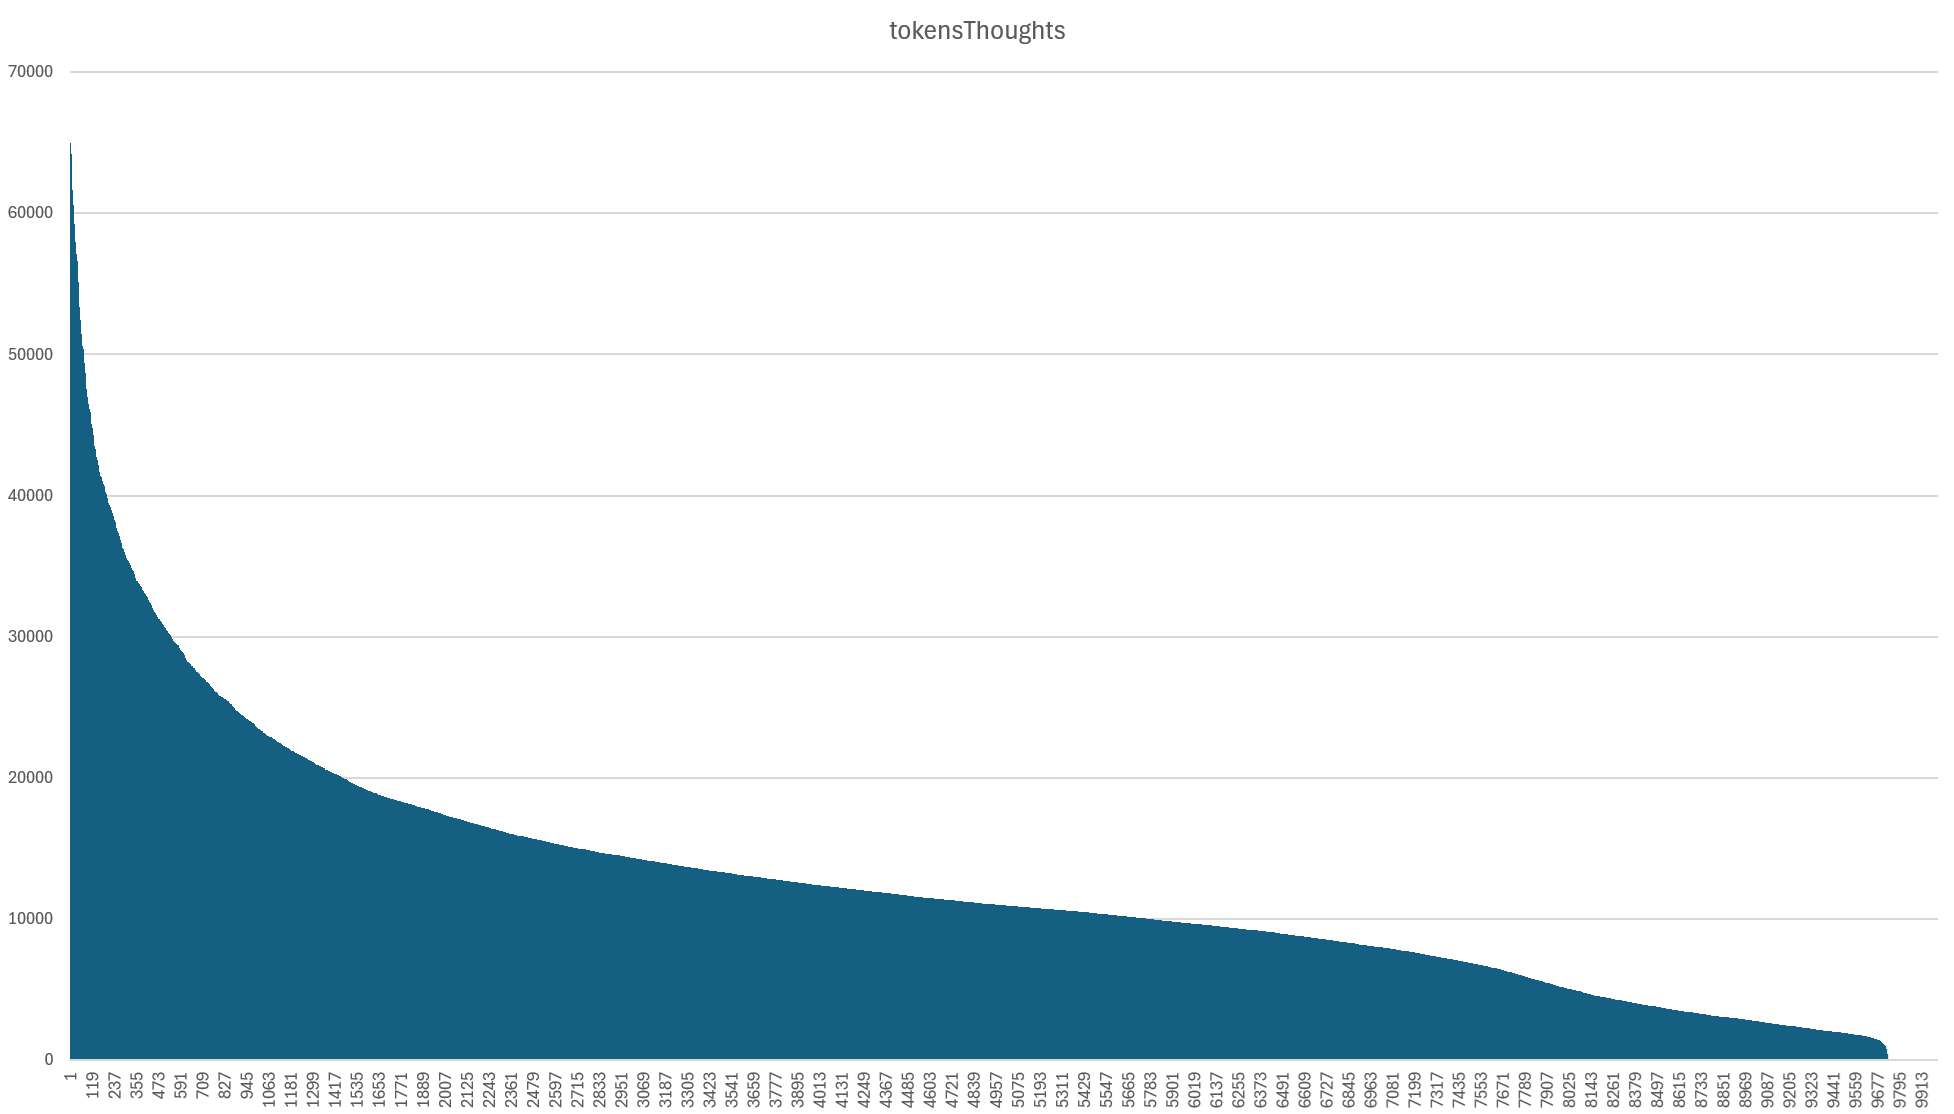
Below is a histogram of the total "thinking" tokens generated by Gemini for each broadcast. Notably, we can see a remarkable resemblance between the thought and output token graphs, with a small percentage of broadcasts consuming an outsized number of thought tokens and a long tail of greater balance between the two. In fact, we can see that the majority of our MAX_TOKEN broadcasts are actually the result of excessive thinking.
While they look similar, the number of output tokens and thinking tokens are only correlated at r=0.426, while input tokens and thought tokens are correlated at r=0.562. Thus, thinking does not linearly scale with either input or output: it is far more unpredictable.
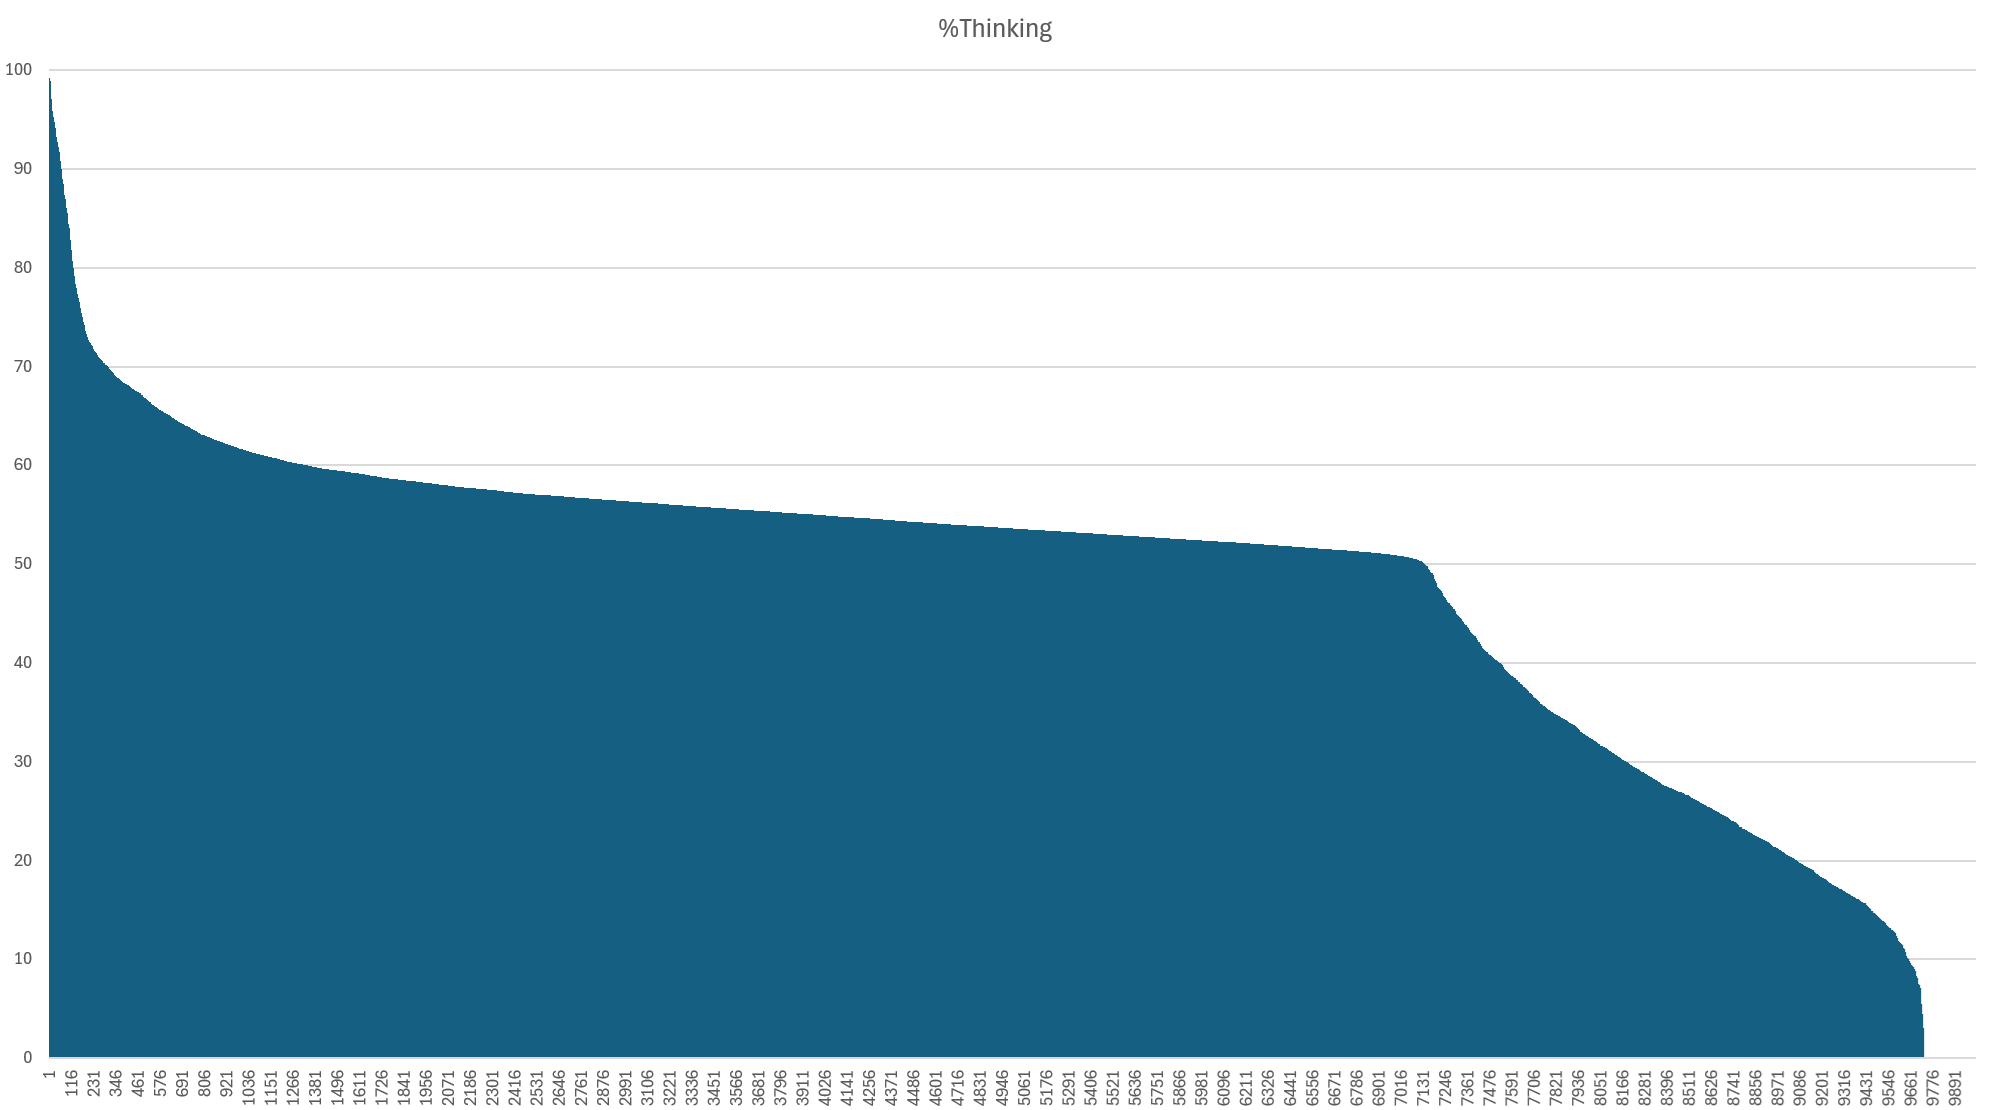
Here we can see this relationship and tradeoff more clearly. At the tail end, we can see that thinking tokens displace output tokens for a subset of broadcasts. At the same time, we can also see an interesting pattern in which for around three quarters of the broadcasts, thinking makes up around half the output, while for the remaining quarter of broadcasts it makes up far less.
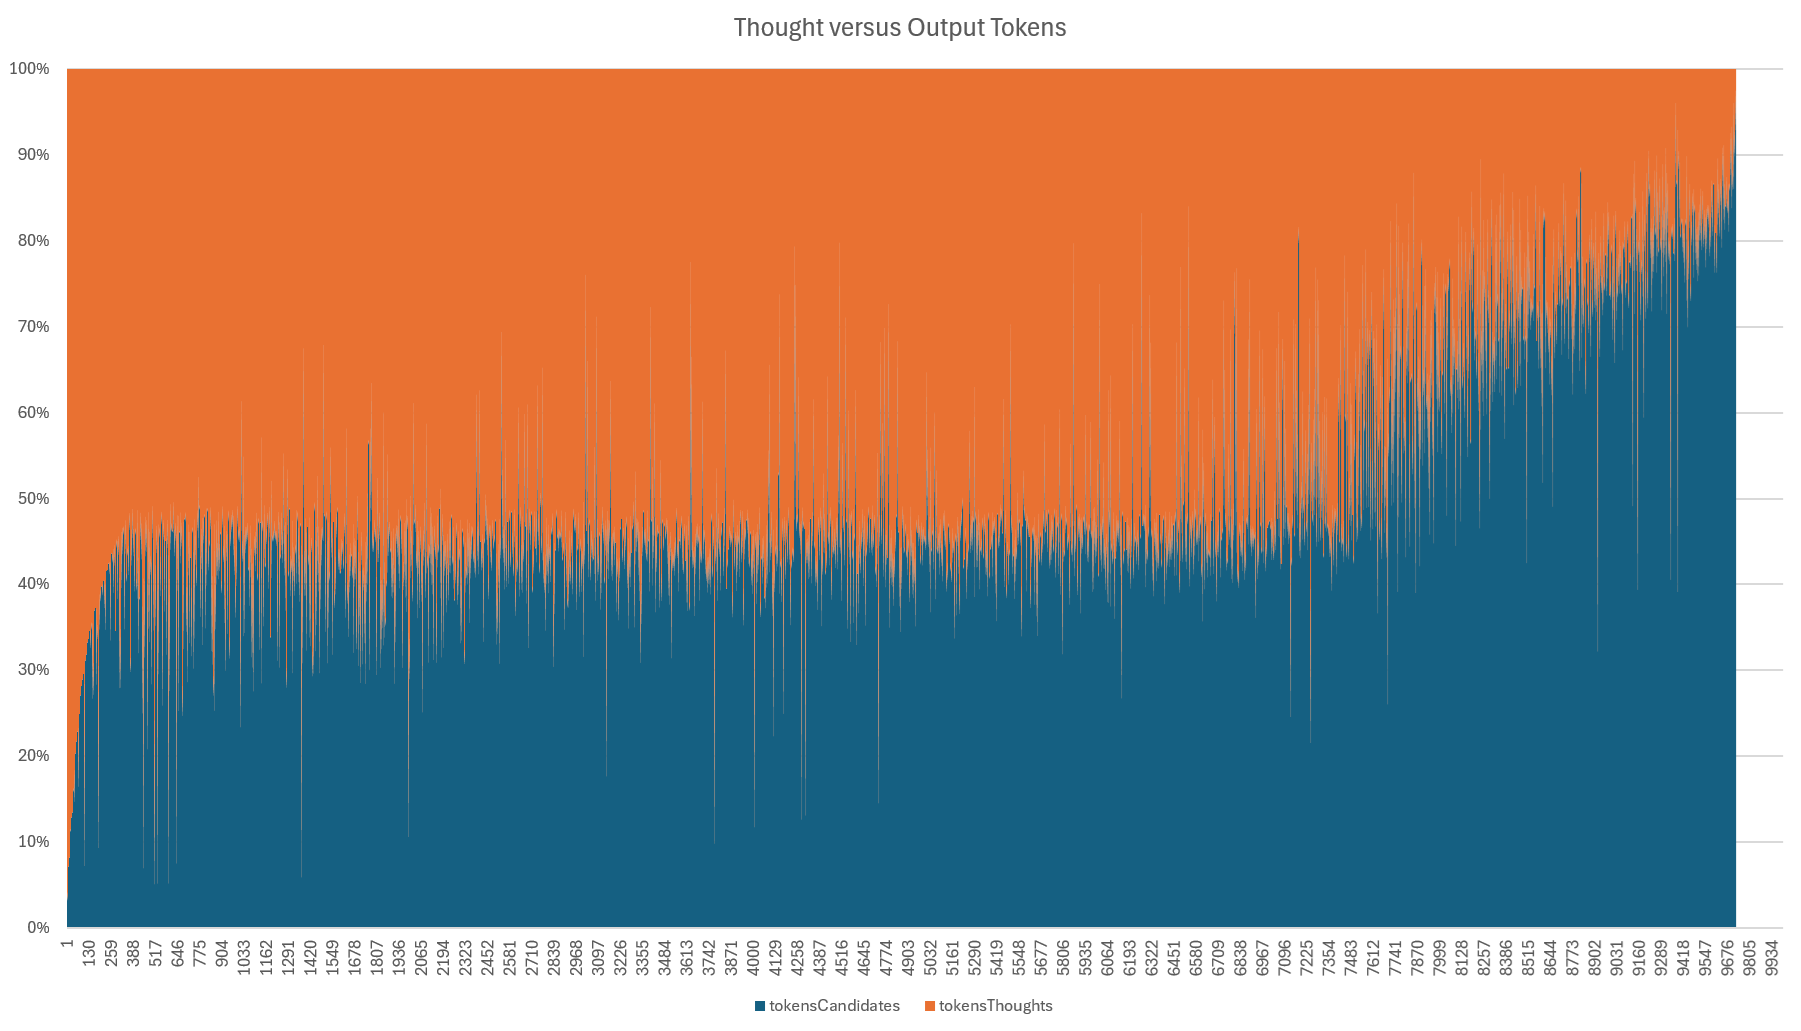
In fact, the graph below shows this fascinating trend in more detail, breaking out the percentage of the total output (output + thinking tokens) consumed by thinking.