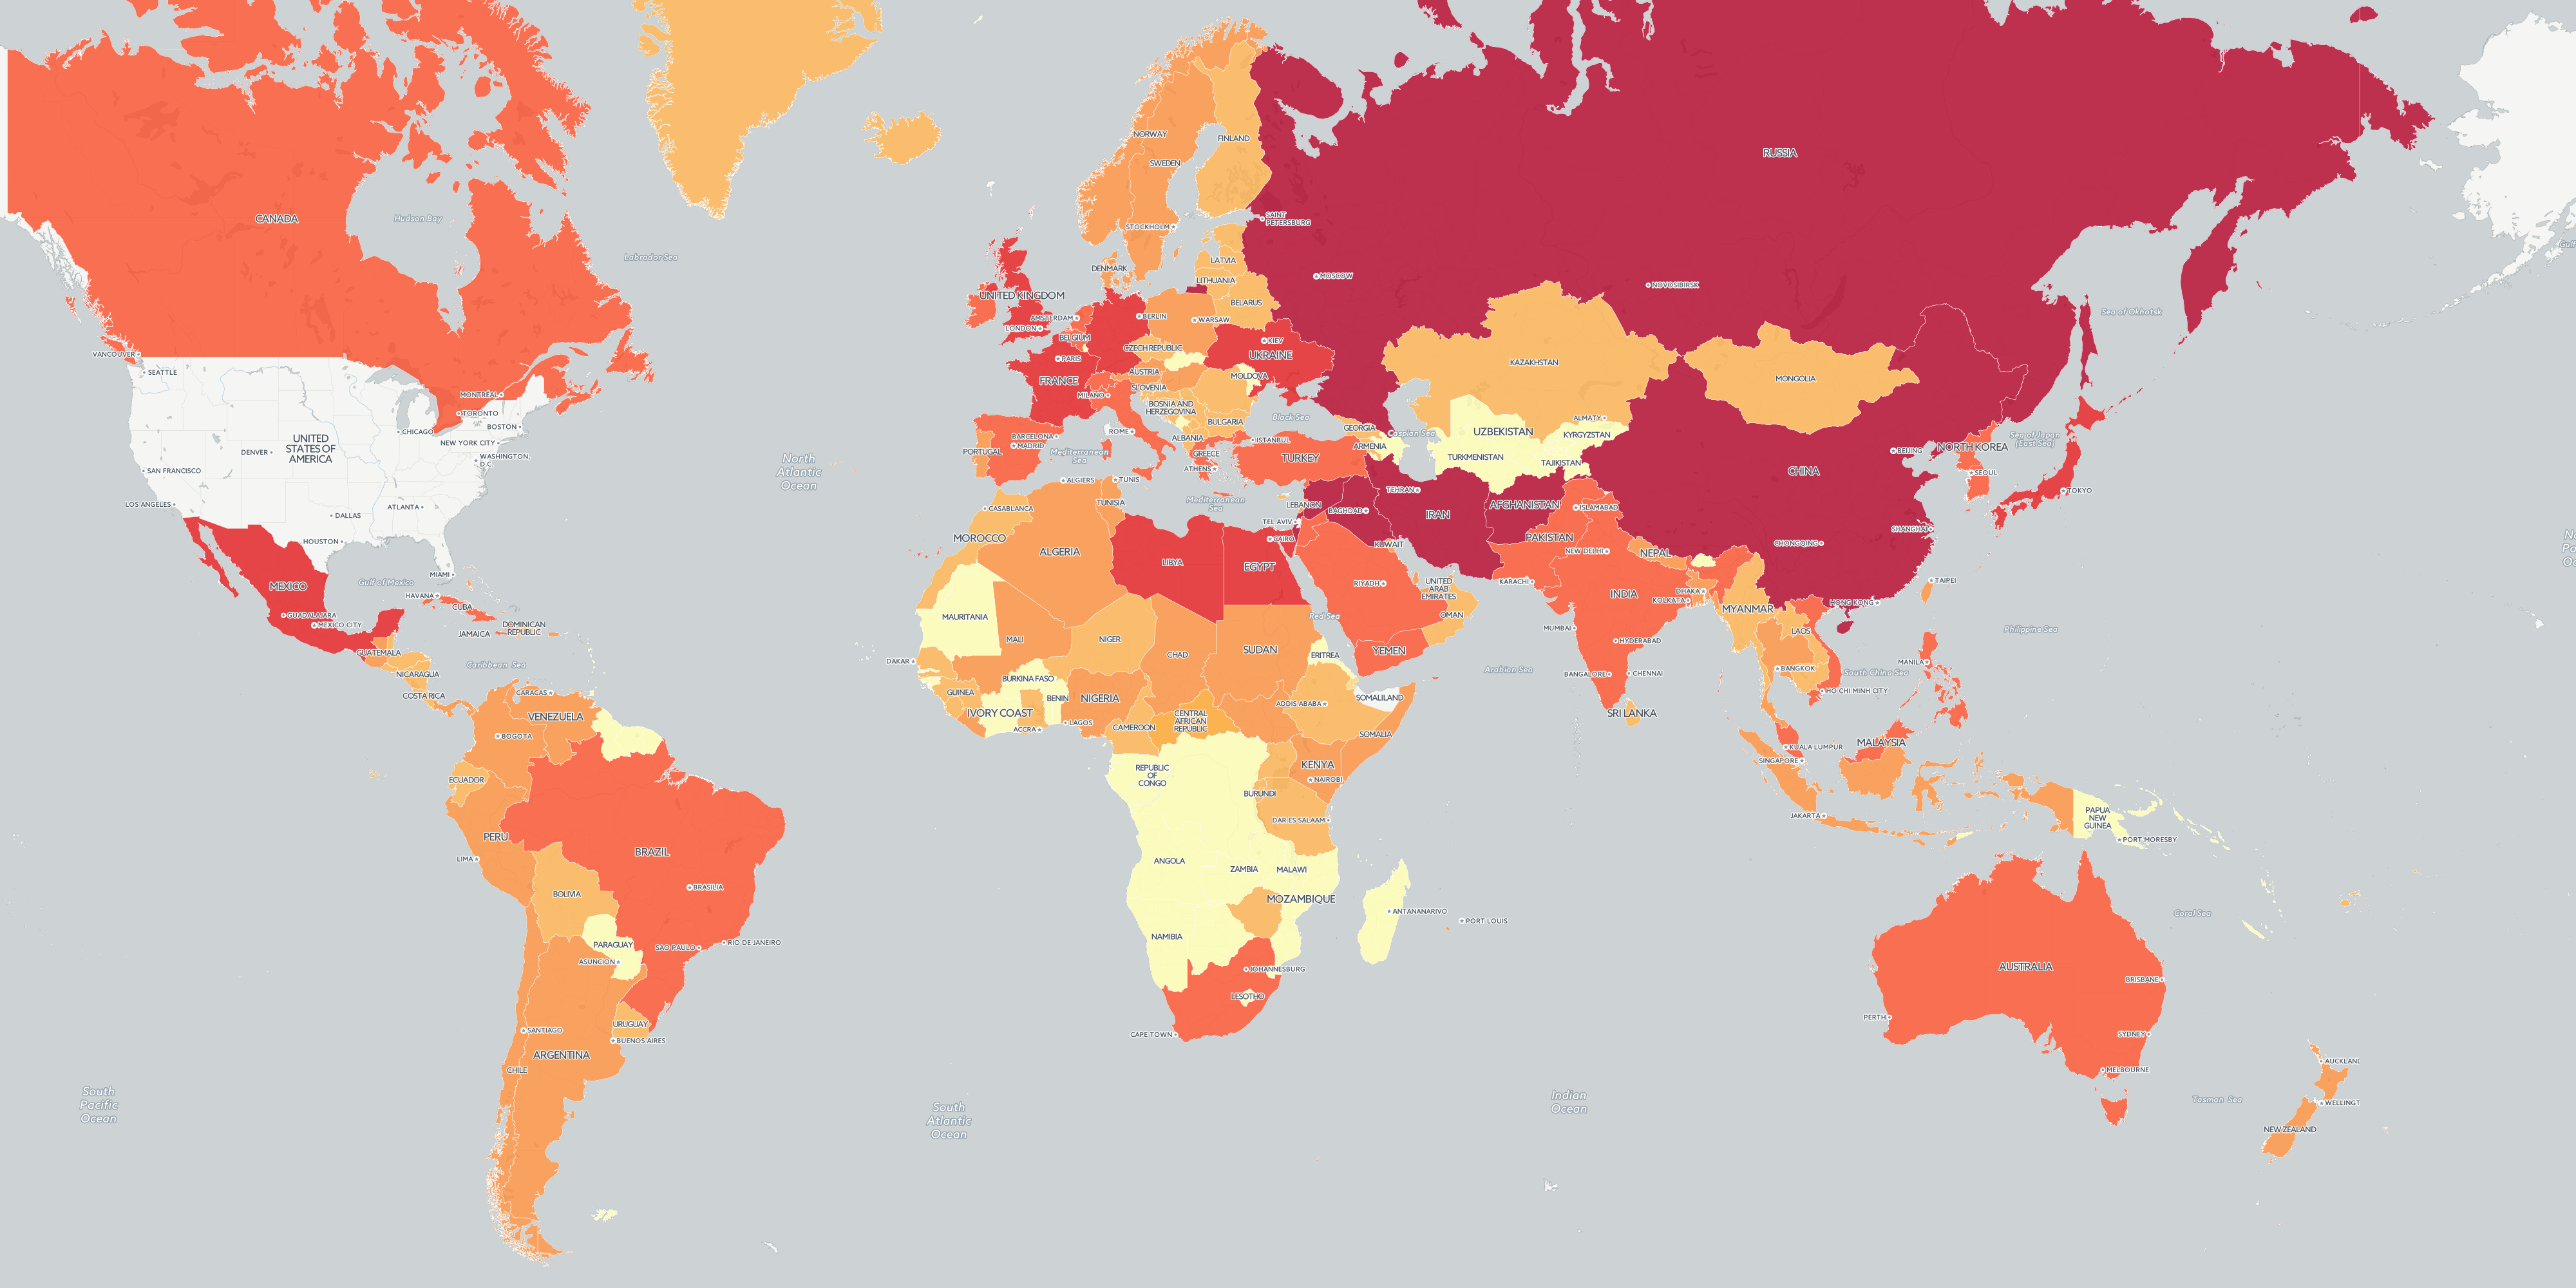
Kalev's latest Forbes piece features a choropleth map visualizing the total number of times each country in the world has been mentioned on American television news shows monitored by the Internet Archive over the last 6 years.
Creating this map required just a single line of code in Google BigQuery and just 2.2 seconds to complete and just a few more seconds to import directly into CartoDB for the final map (CartoDB automatically recognizes the country names and geocodes them into final polygonal choropleth form). Note that an SQL filter was applied in CartoDB to remove the US from the map to rescale the raw counts to better show differentiation across the rest of the world.
select a.countrycode CountryCode, b.country CountryName, a.cnt Count from (
select countrycode, count(1) cnt from (
select REGEXP_EXTRACT(SPLIT(V2Locations,';'),r'^[1-5]#.*?#(.*?)#') countrycode
FROM [gdelt-bq:gdeltv2.iatvgkg]
where DATE>20090000000000
) group by countrycode
) a
JOIN EACH (
select fips, country from [gdelt-bq:extra.countryinfo]) b
ON a.countrycode = b.fips order by a.cnt desc