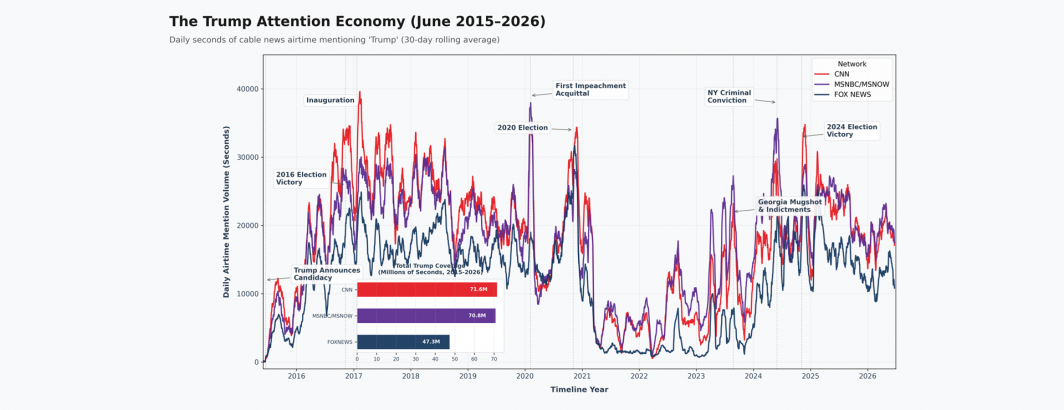
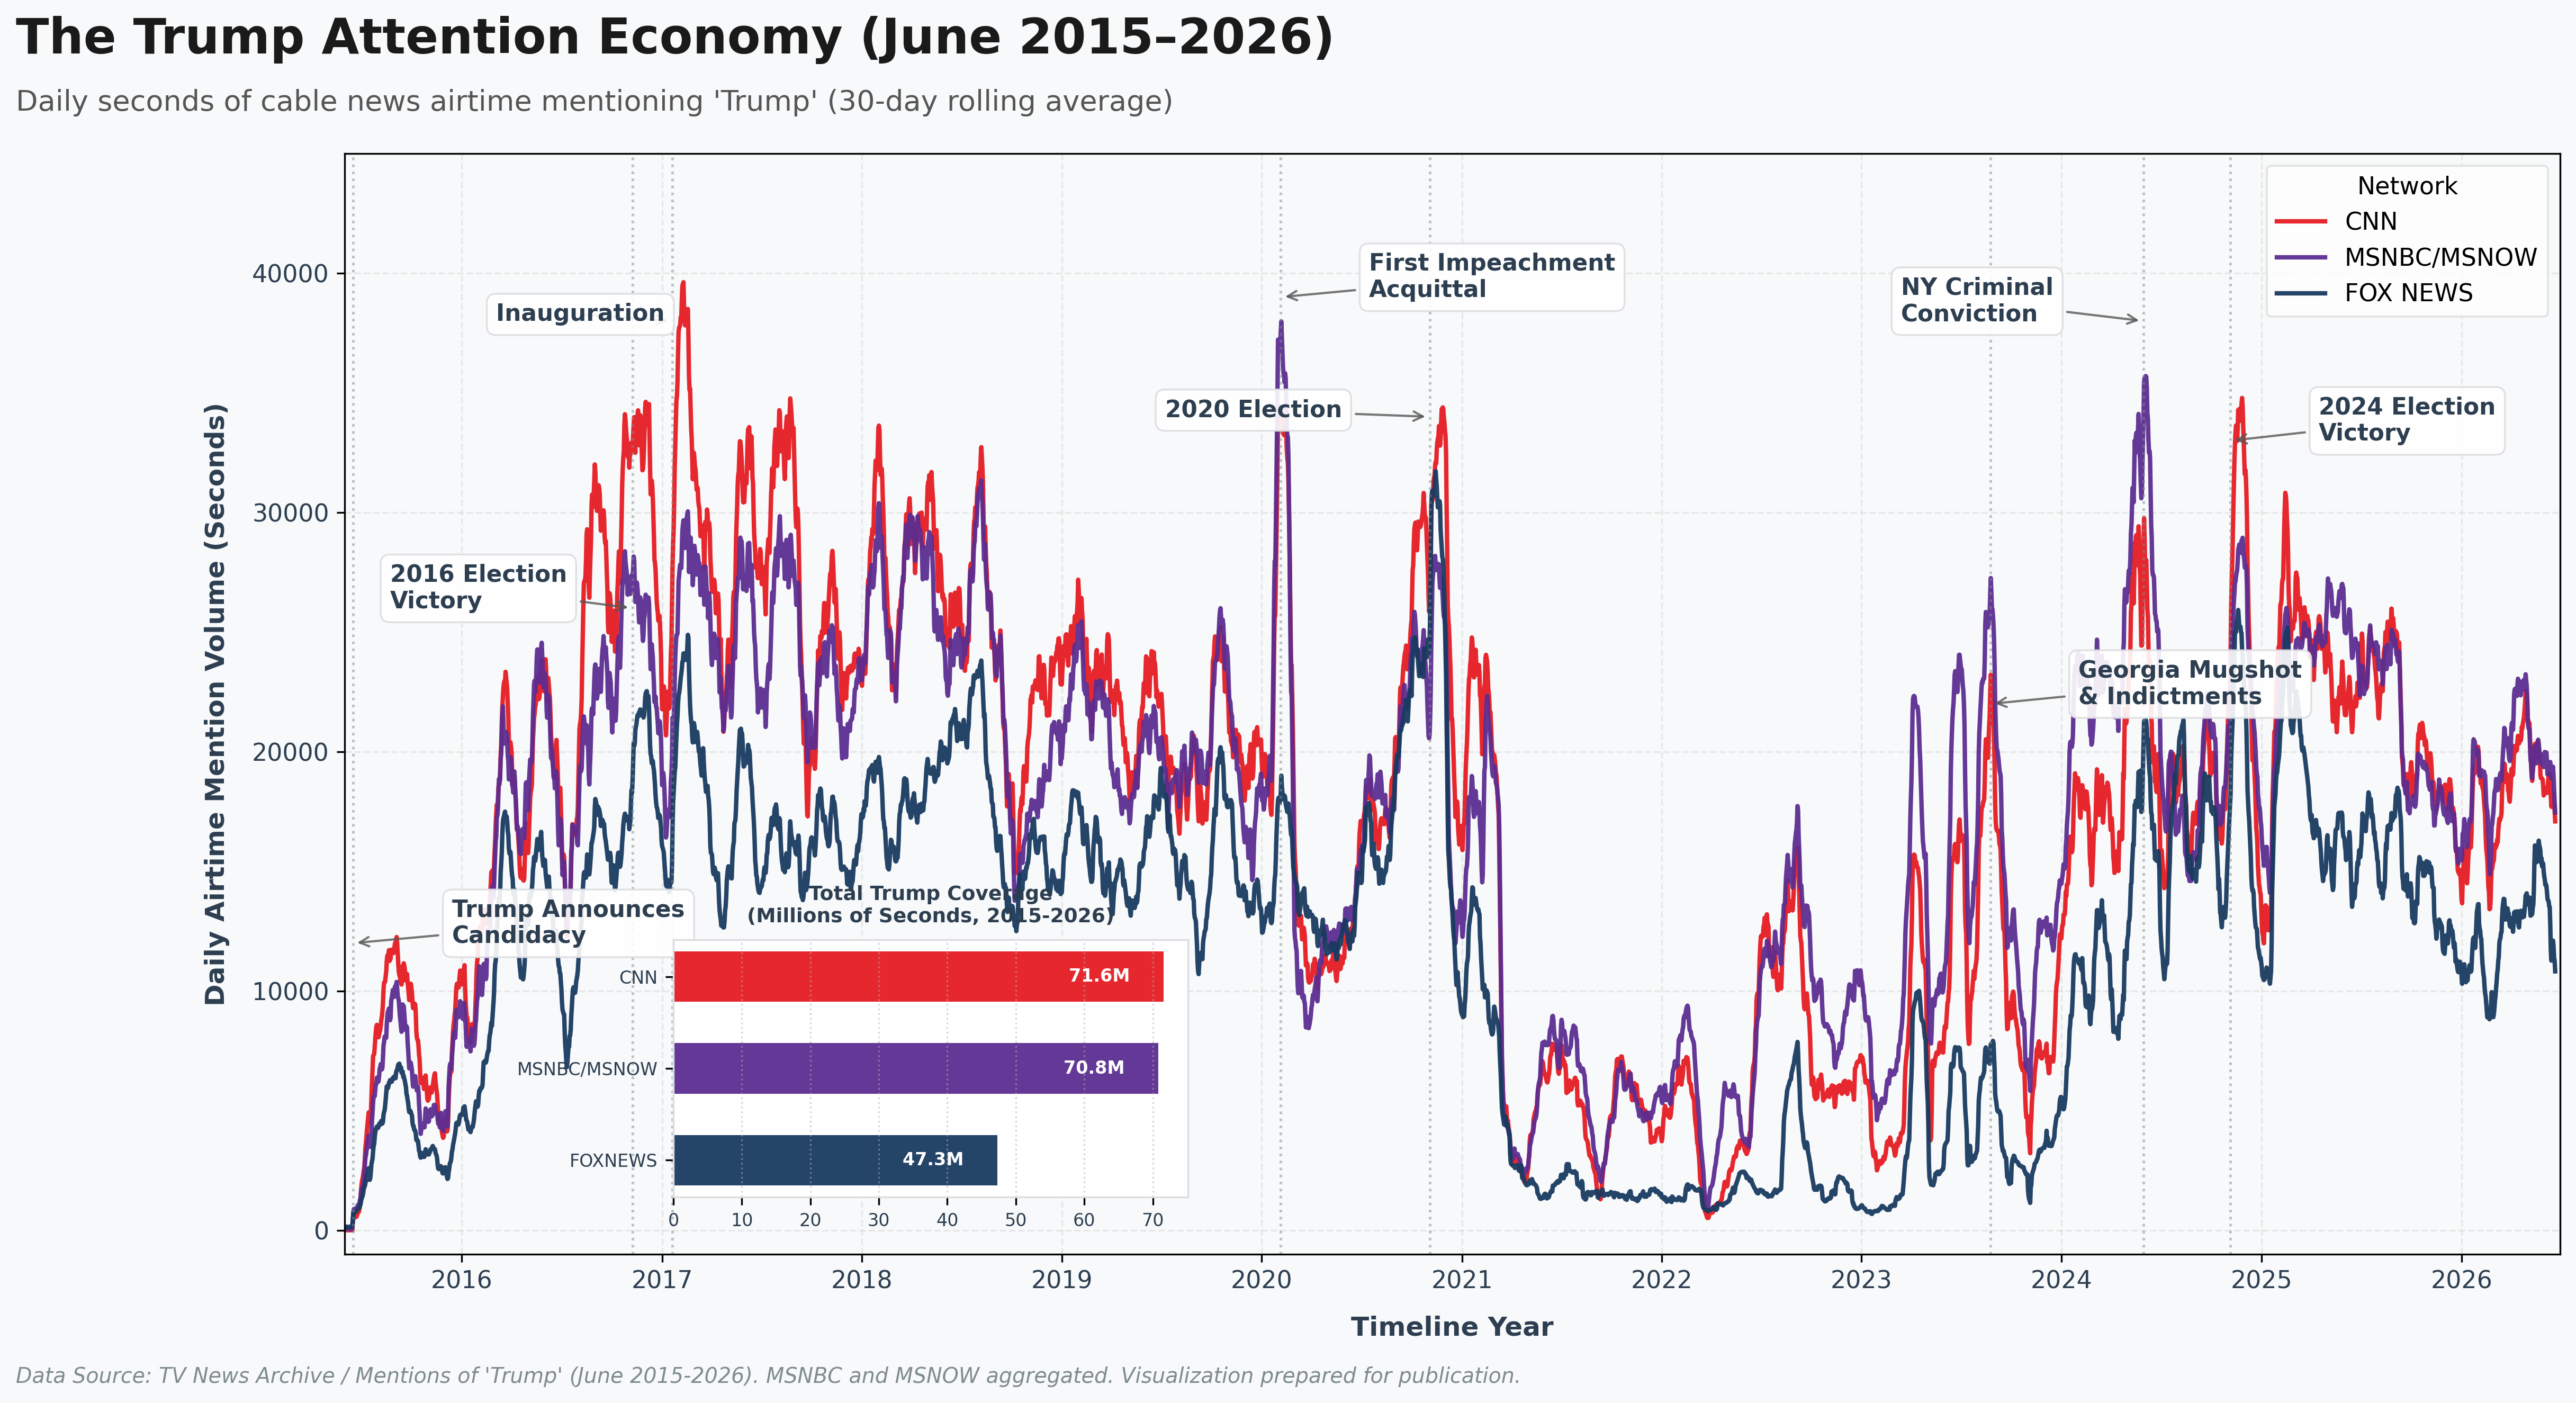
The timeline below charts the seconds of airtime each day in which the word "Trump" appeared somewhere in the onscreen text of CNN, MSNBC/MSNOW and Fox News from June 1, 2015 to present, using the Internet Archive's TV News Archive. Over the past decade CNN and MSNBC/MSNOW have both displayed his name onscreen for around 71 million seconds (1.18M minutes / 19,722 hours) in total, while Fox News has aired his name noticeably less, at around 47M seconds. Gemini was used to produce the visualization and narrative below using only the CSV timeline and no data was used to train or tune any model.
And Gemini's analysis:
Annotated Timeline of Key Historical Milestones
By analyzing the smoothed data, we identified eight distinct inflection points. These represent the major structural peaks in the "Trump Attention Economy" and have been permanently annotated on the final chart:
- June 16, 2015 — The Announcement: Prior to this date, Trump’s average daily airtime across all three networks combined was under 200 seconds. Following his "escalator speech," daily airtime immediately jumped to over 10,000 seconds on CNN and MSNBC.
- November 8, 2016 — The 2016 Election: The first massive, sustained peak of the dataset, where daily airtime routinely crossed 25,000 seconds per network.
- January 20, 2017 — Inauguration & Early Executive Orders: The absolute peak of Trump-related coverage on CNN occurred in February 2017 (averaging 39,623 seconds per day—nearly 11 hours of daily coverage), driven by the immediate rollout of controversial executive orders (e.g., the travel ban) and administration personnel changes.
- February 5, 2020 — First Impeachment Acquittal: An isolated, vertical spike in early 2020 where MSNBC/MSNOW reached its single-day historical maximum of 37,980 seconds of coverage.
- November 3, 2020 — The 2020 Election & Dispute: A massive, broad peak spanning November and December 2020. Interestingly, Fox News recorded its highest-ever historical peak during this period, averaging 31,724 daily seconds of Trump mentions in mid-November.
- August 24, 2023 — Georgia Indictment & Mugshot: After a post-presidential lull in 2021–2022, Trump's media footprint re-accelerated sharply with his criminal indictments, peaking when his mugshot was released by the Fulton County Sheriff's Office.
- May 30, 2024 — New York Criminal Conviction: A severe peak in mid-2024 as the Manhattan hush-money trial concluded with a guilty verdict.
- November 5, 2024 — 2024 Election & Transition: A final massive peak representing Trump's return to the presidency, establishing a new baseline of 15,000–25,000 seconds per day through early 2026.
Empirical Insights: Media Dynamics & Asymmetry
The most notable finding from this dataset is the significant asymmetry in coverage volume between the networks.
Cumulative All-Time Trump Airtime (2011–2026)
Across the entire 15-year span, the total seconds of airtime mentioning "Trump" reveals that the center-left and liberal-leaning networks focused far more heavily on Trump than Fox News did:
| Network | Total Cumulative Airtime (Seconds) | Percentage of Total 3-Network Coverage |
| CNN | 71,832,021 | 37.7% |
| MSNBC/MSNOW | 70,981,836 | 37.2% |
| FOX NEWS | 47,749,088 | 25.1% |
- The Attention Gap: CNN and MSNBC/MSNOW covered Trump almost identically in terms of sheer volume, each dedicating roughly 71 million seconds (approx. 19,700 hours) to him.
- The Fox News Variance: Fox News dedicated roughly 47.7 million seconds (approx. 13,250 hours) to Trump—meaning CNN and MSNBC covered him 50% more in total volume than Fox News. This suggests that while Trump was a polarizing figure across all networks, his presence served as the dominant editorial and narrative driver for center-left programming.
- The High Post-Presidency Baseline: During Trump's post-presidency "lull" (2021–2022), his average daily airtime fell significantly from its presidential peaks, but still hovered between 3,000 to 7,000 seconds per day on CNN and MSNBC. For comparison, this "lull" baseline was still 20 to 30 times higher than his pre-2015 baseline, demonstrating that he never truly left the center of the national media landscape.
Year-by-Year Total Airtime Summary (Seconds)
To trace this progression numerically, the table below shows the yearly sum of Trump-mention airtime (in seconds) for each network:
| Year | CNN (Seconds) | Fox News (Seconds) | MSNBC/MSNOW (Seconds) | Combined Total (Hours) |
| 2011 | 149,392 | 205,929 | 118,228 | 131.5 hrs |
| 2012 | 75,278 | 143,714 | 56,393 | 76.5 hrs |
| 2013 | 20,914 | 52,879 | 12,725 | 24.0 hrs |
| 2014 | 2,859 | 32,939 | 4,223 | 11.1 hrs |
| 2015 | 1,582,752 | 852,192 | 1,313,557 | 1,041.2 hrs |
| 2016 | 8,179,205 | 5,137,214 | 7,212,959 | 5,702.6 hrs |
| 2017 | 10,186,073 | 6,239,140 | 8,996,014 | 7,061.4 hrs |
| 2018 | 9,322,999 | 6,461,292 | 8,707,621 | 6,803.3 hrs |
| 2019 | 7,763,899 | 5,628,600 | 7,404,175 | 5,776.8 hrs |
| 2020 | 7,270,236 | 6,115,949 | 6,714,733 | 5,583.5 hrs |
| 2021 | 2,752,532 | 1,228,531 | 2,742,140 | 1,867.5 hrs |
| 2022 | 2,461,434 | 752,300 | 3,135,241 | 1,763.6 hrs |
| 2023 | 3,547,300 | 1,455,769 | 4,984,593 | 2,774.3 hrs |
| 2024 | 7,295,803 | 5,458,871 | 8,181,737 | 5,815.7 hrs |
| 2025 | 7,980,059 | 5,805,471 | 8,010,777 | 6,054.5 hrs |
| 2026 * | 3,219,938 | 2,162,473 | 3,379,468 | 2,433.8 hrs |
*Note: 2026 data is partial, representing January 1 through June 21, 2026.