The GKG 2.0 is essentially a realtime metadata index over the world's news in 65 languages dating back to 2015. A typical use case is to filter it to identify coverage mentioning a specific topic or location or combination of both. However, a simple filter that just looks for articles containing a given topic in the V2Themes field and a given location in the V2Locations field will yield a lot of irrelevant matches, since the topic of interest might be mentioned at the start of the article and the location of interest mentioned in an unrelated context at the bottom. Thus, when BigQuery first debuted the ability to use custom JavaScript User Defined Functions (UDF's), we showcased how a simple UDF could be used to parse through the V2Locations field to identify each distinct location mention in the article, then parse the V2Themes field and assign each theme mention to the nearest location mention in the text within a given window. In other words, it takes each location mention in an article and compiles a list of the themes mentioned within a given number of characters of that location in the text under the assumption that if "quarantine" is mentioned within a few words of "California" they are potentially related.
While relying exclusively on proximity within the text to determine relatedness, rather than grammatical cues, this simple approach works extremely well at scale and could be implemented entirely inside of BigQuery, allowing it to execute at BigQuery's petascale scaling. Since the original UDF code was written for BigQuery's Legacy SQL, we've updated it for Standard SQL.
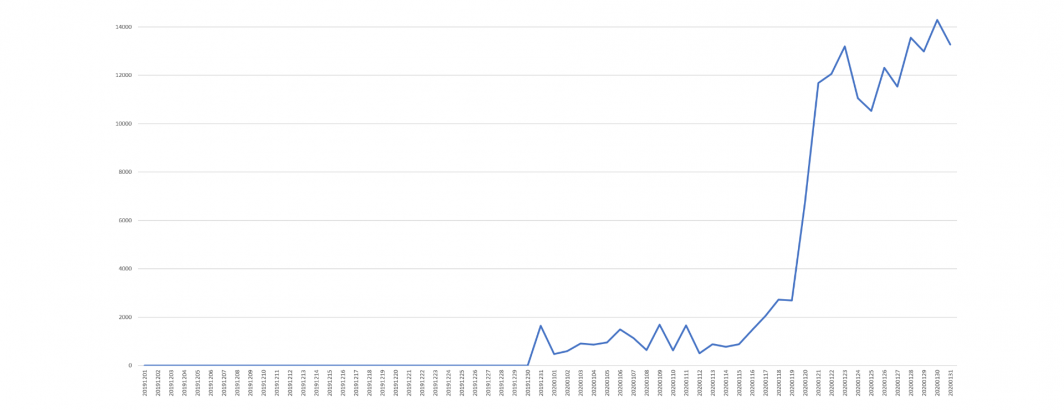
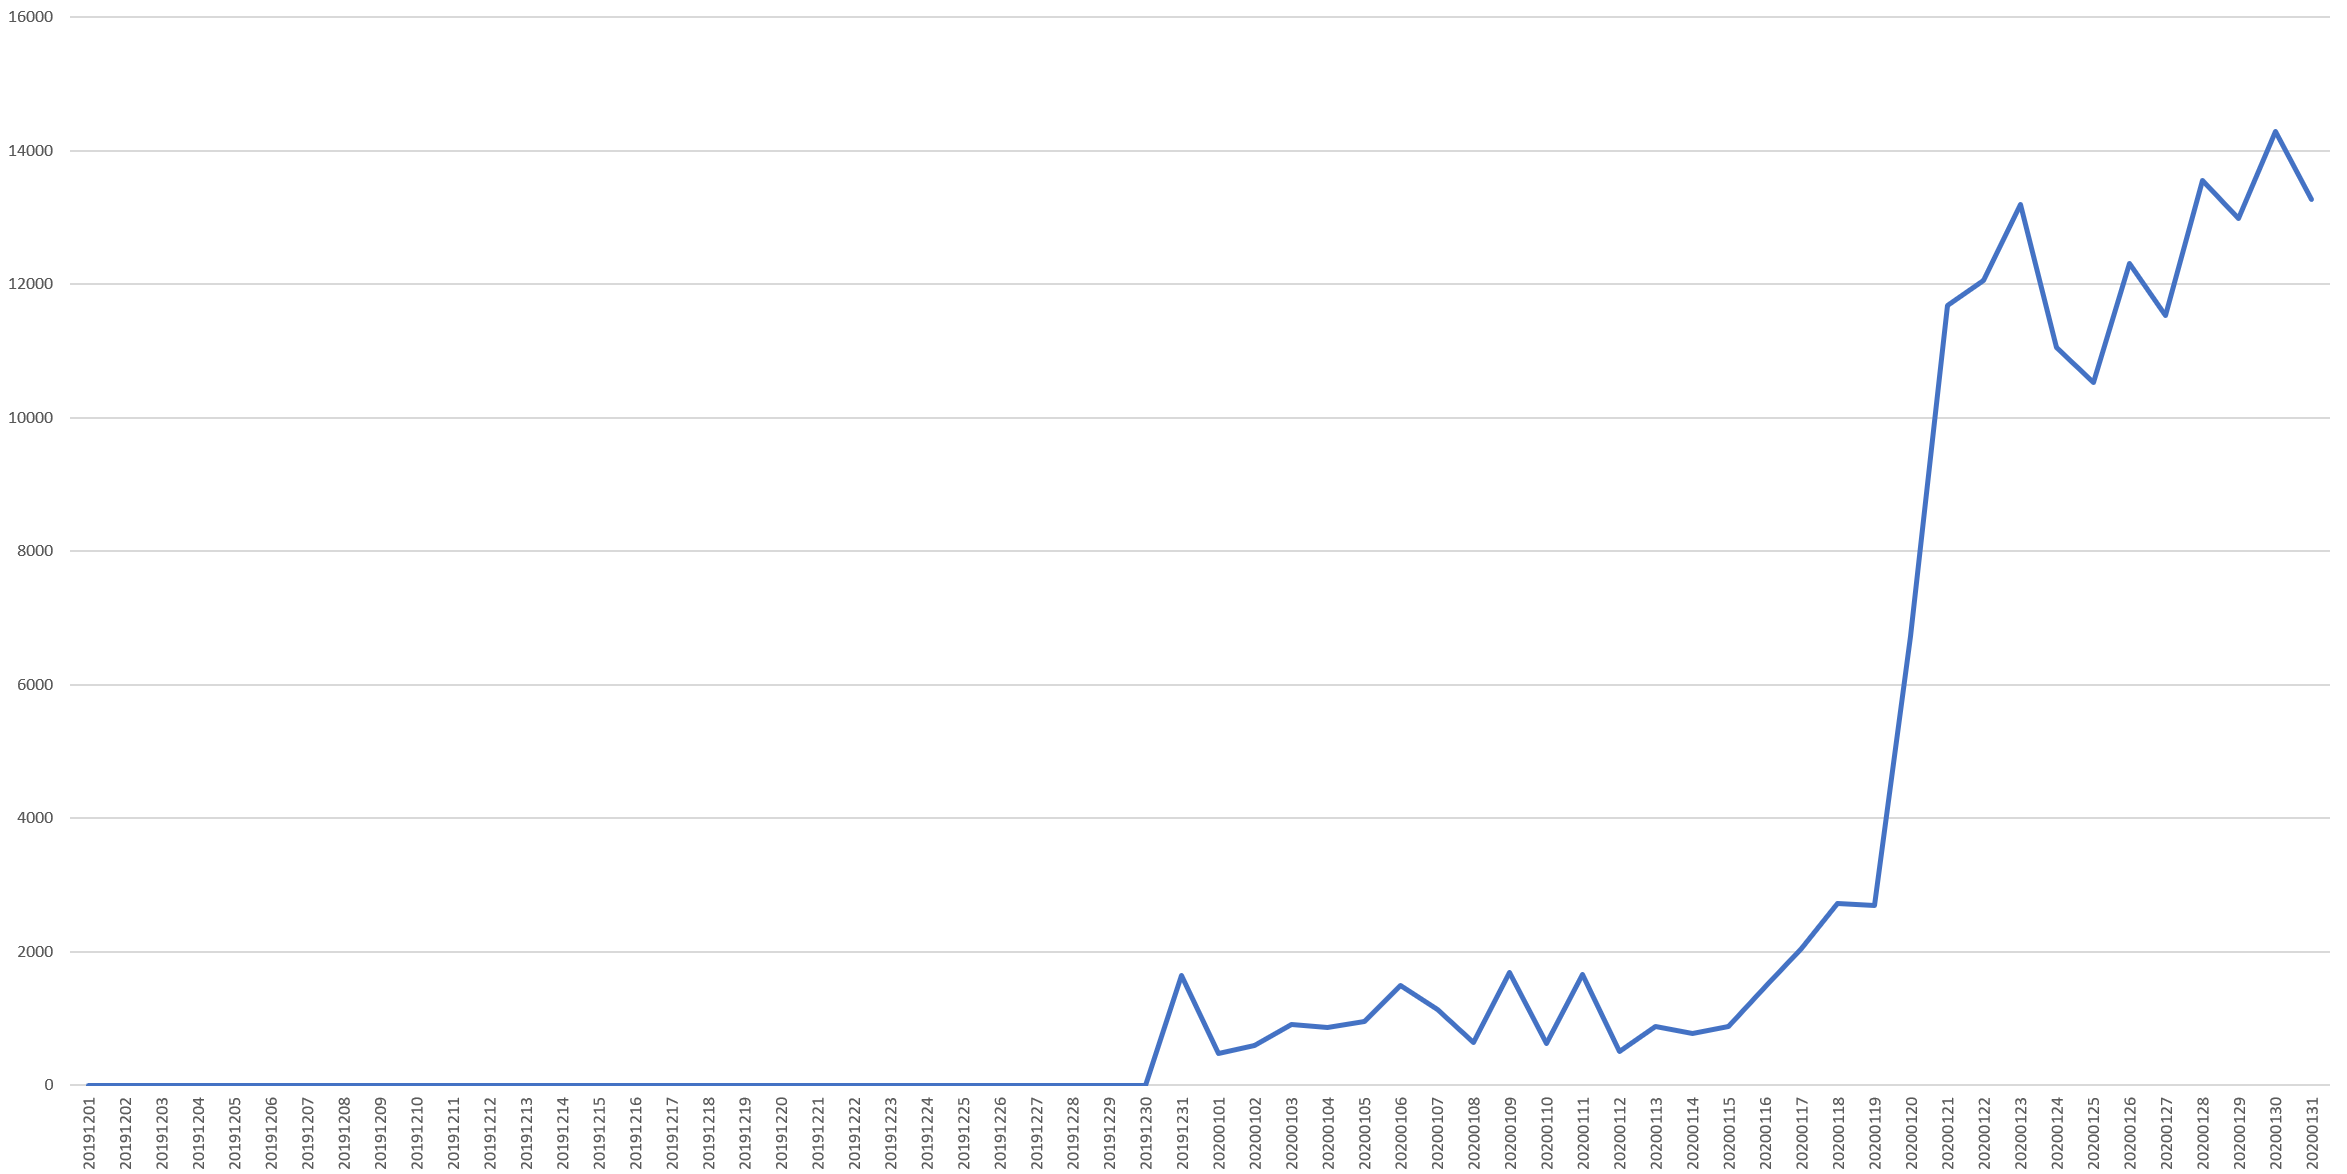
Given all of the domestic Chinese-language coverage of Covid-19 relating to Wuhan on December 31, 2019, we wondered whether this approach could have trivially alerted to the explosion of media coverage across the country that day regarding an outbreak of "SARS-like viral pneumonia" in Wuhan. To examine this, we searched for all mentions of "pneumonia" within 150 characters of Wuhan from 12/1/2019 to 1/31/2020.
You can find the full query below, but the end result is this graph, showing zero to one mentions a day until a burst of 1,649 mentions throughout the day on December 31, 2019, remaining elevated through a vertical surge on January 20, 2020 as the story garnered international attention (all dates in UTC).
How quickly did mentions grow on December 31, 2019? Taking the query at the bottom of this post and changing the date casting to "SUBSTR(CAST(DATE AS STRING), 0, 10) day" and the date limiter to "DATE(_PARTITIONTIME) = "2019-12-31"" we can graph the hour-by-hour surge in mentions of "pneumonia" near "Wuhan." We've also converted from UTC to EST timezone, showing that mentions surged vertically between 10PM and 11PM EST on December 30, 2019 and continued their vertical ascent over the following hour, remaining high through the 5AM hour, at which point they decreased but remained highly elevated.
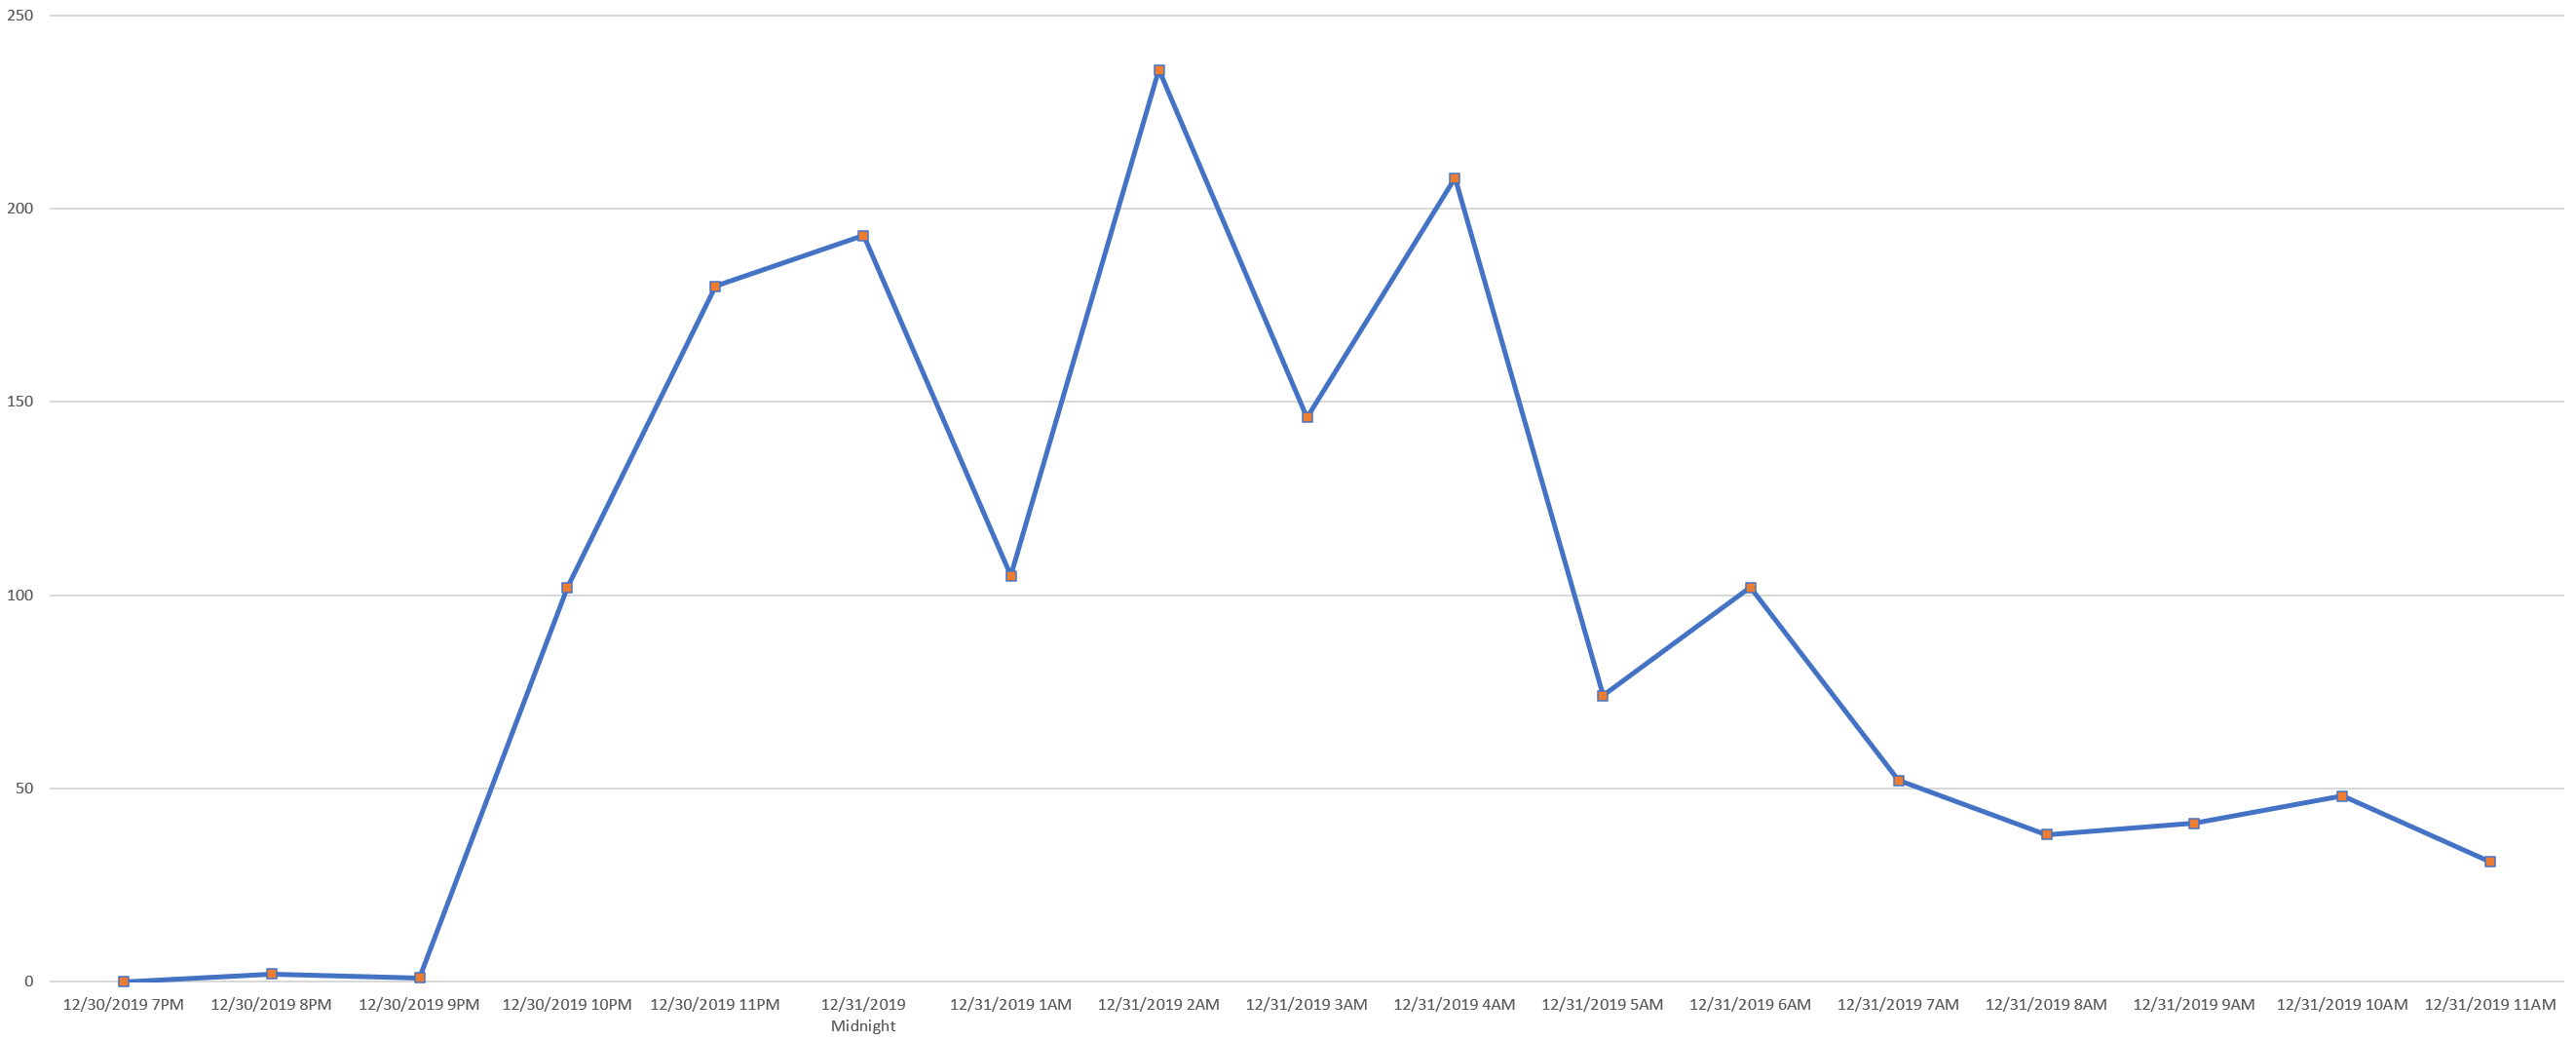
Thus, had one been watching for mentions of Pneumonia on December 30, 2019, one would have seen a surge in mentions of Wuhan, China around 10PM New York time representing the beginning of the Covid-19 pandemic to come.
TECHNICAL DETAILS
Creating the graphs above required just a single query in BigQuery using its UDF capabilities.
CREATE TEMP FUNCTION GKGThemeListByLocation(V2Locations STRING, V2Themes STRING)
RETURNS ARRAY<STRUCT<LocationType INT64, LocationName STRING, Latitude STRING, Longitude STRING, AssociatedThemes STRING>>
LANGUAGE js AS r"""
  var MAX_DISTANCE = 150;
  var results = [];
  if (V2Locations === null || V2Themes === null) {
    return;
  }
  var locations = String(V2Locations).split(';');
  var themes = String(V2Themes).split(';');

  for (var location of locations) {
    var locationFields = location.split('#');

    if (locationFields.length < 2) {
        continue;
    }
    var locationOffset = parseInt(locationFields[locationFields.length - 1], 10);
    var closeThemes = [];

    for(var theme of themes) {
       var themeFields = theme.split(',');

       if (themeFields.length < 2) { continue; }
       var themeName = themeFields[0];
       var themeOffset = parseInt(themeFields[1], 10);
       if ((locationOffset > themeOffset && locationOffset - themeOffset < MAX_DISTANCE)
          || (locationOffset < themeOffset && themeOffset - locationOffset < MAX_DISTANCE)) {
          //closeThemes.push(themeName + ',' + themeOffset); this emits the theme offsets if desired
          closeThemes.push(themeName);
       }
    } //end loop over each theme

    if (closeThemes.length > 0) {
       results.push( { LocationType: locationFields[0], LocationName: locationFields[1], Latitude: locationFields[5], Longitude: locationFields[6], AssociatedThemes: closeThemes.join(';') } );
    }

 } //end loop over each location
 return results;
""";

select SUBSTR(CAST(DATE AS STRING), 0, 8) day, count(1) cnt from (
select DATE, DocumentIdentifier, geotheme.LocationName, geotheme.LocationType, geotheme.Latitude, geotheme.Longitude, geotheme.AssociatedThemes from (
SELECT DATE, DocumentIdentifier, GKGThemeListByLocation(V2Locations, V2Themes) geothemes FROM `gdelt-bq.gdeltv2.gkg_partitioned` WHERE DATE(_PARTITIONTIME) >= "2019-12-01" and DATE(_PARTITIONTIME) <= "2020-01-31"
and V2Locations like '%Wuhan%' and (Themes like '%TAX_DISEASE_PNEUMONIA%')
), unnest(geothemes) geotheme where geotheme.LocationName like '%Wuhan%' and geotheme.AssociatedThemes like '%TAX_DISEASE_PNEUMONIA%'
) group by day order by day asc