Last year we explored how GCP's Network Intelligence Network Topology mapping can be used to understand the network flows across a project. In that example we looked at assessing inter-VM flows across a GCE cluster. What does it look like to visualize instead the flow between GCE VMs and GCP core services?
Network Intelligence' Network Topology allows us to visualize the network flows within GCP projects in various ways, including a wealth of different aggregations and filters, such as geographic, regional, service-based, etc. We can visualize flows between VMs, which we've looked at in the past. But, more interestingly for many use cases is the ability to visualize flows between VMs and GCP core services, such as GCS and various AI/analytic APIs, from translation and transcription to video and image analysis.
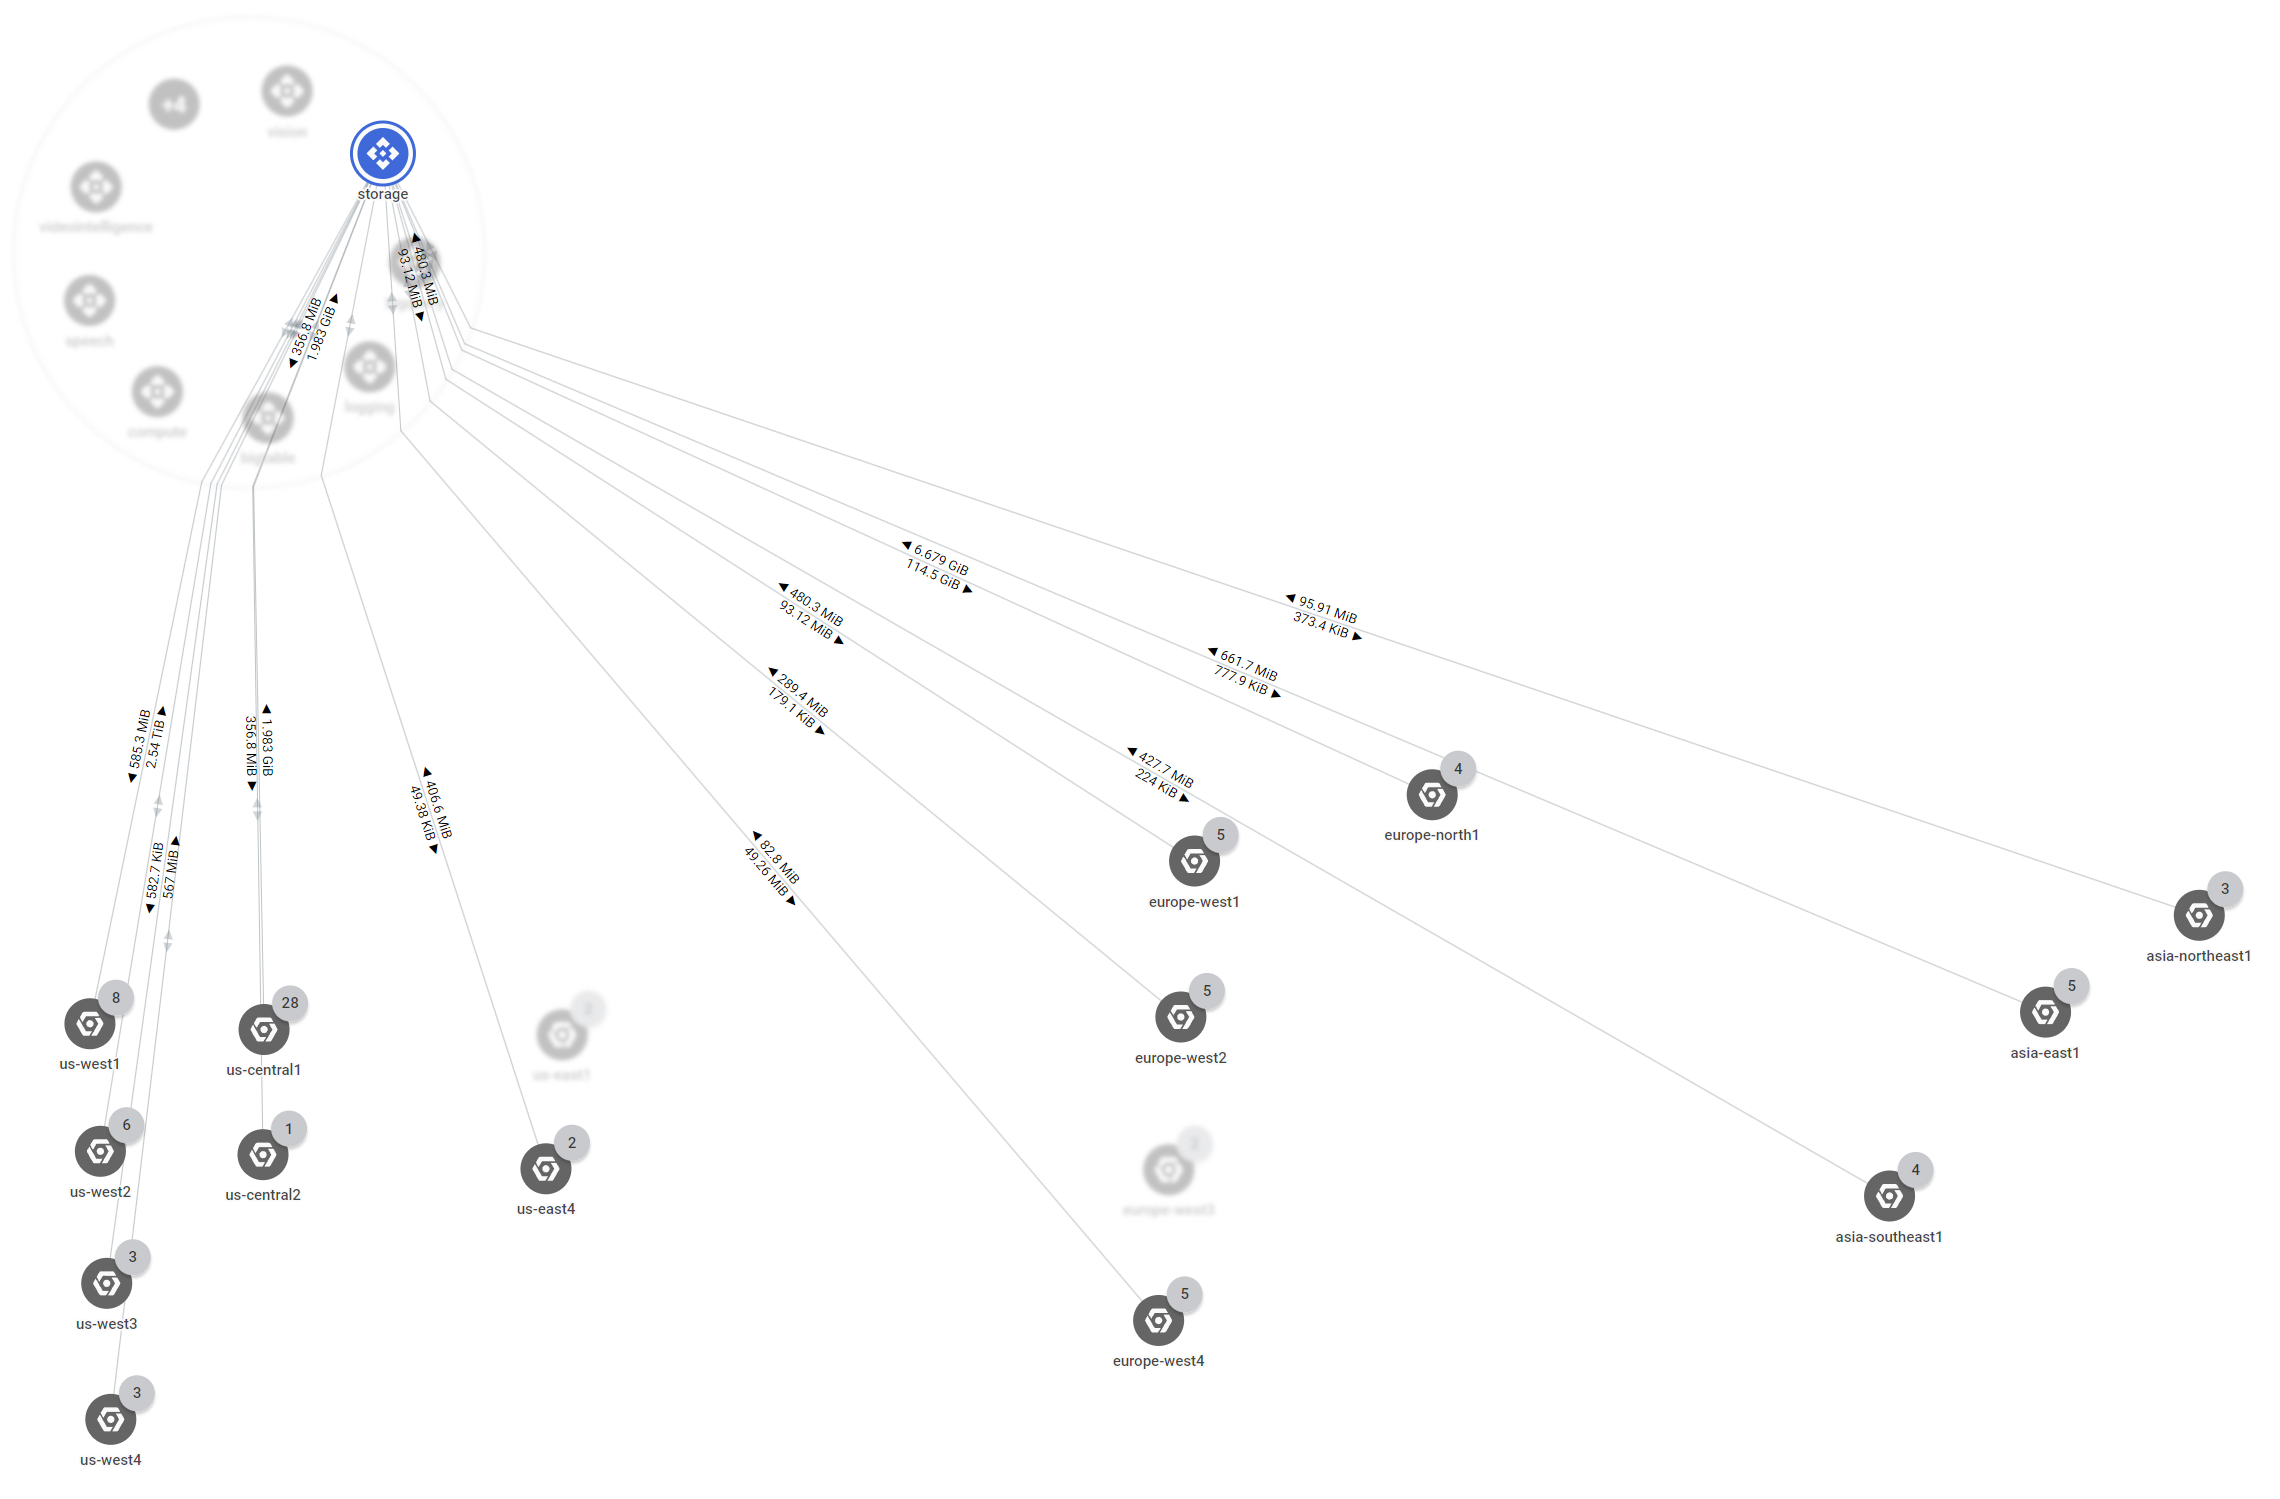
Below is an aggregate look by GCP region at the flows between GCS and one small task-specific ingest microcluster during a single hour today. We can see immediately that this cluster is largely responsible for ingest, given that the flows are largely in the direction of GCS, though with a notable reverse flow to a processing node in europe-north1 (114.5GiB), as well as a set of high-bandwidth ingest nodes in us-west1 totaling 2.54TiB inbound to GCS.
sdf