Planetary-scale systems like GDELT leverage the full capability of the modern cloud to move enormous volumes of data across the world as it ingests and analyzes global reporting. Such immensely complex systems can exhibit similarly intricately complex behaviors that can be difficult to fully understand at the level of a single VM or cluster. Sometimes the most powerful insights come from looking across entire subsystems via GCP's Cloud Logging and Network Intelligence Center visualizations.
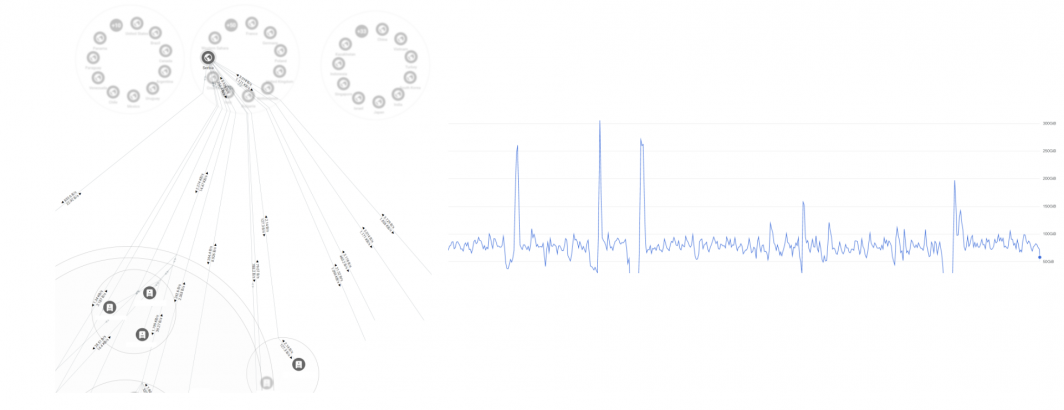
For example, the timeline below plots a brief glimpse of a single small ingest subsystem, capturing both its steady-state behavior and anomalous peaks and troughs. In this case it is immediately clear that isolated instantaneous peaks can reach more than 3x its steady-state ingest bandwidth for brief bursts. By visualizing in this manner, the troughs preceding those instantaneous peaks are clearly visible as leading edge indicators of technical issues in the upstream data feed that signal an impending surge – suggesting that such anomalies could be used to prewarm additional downstream processing capability to reduce the pressure on automated scaling systems.
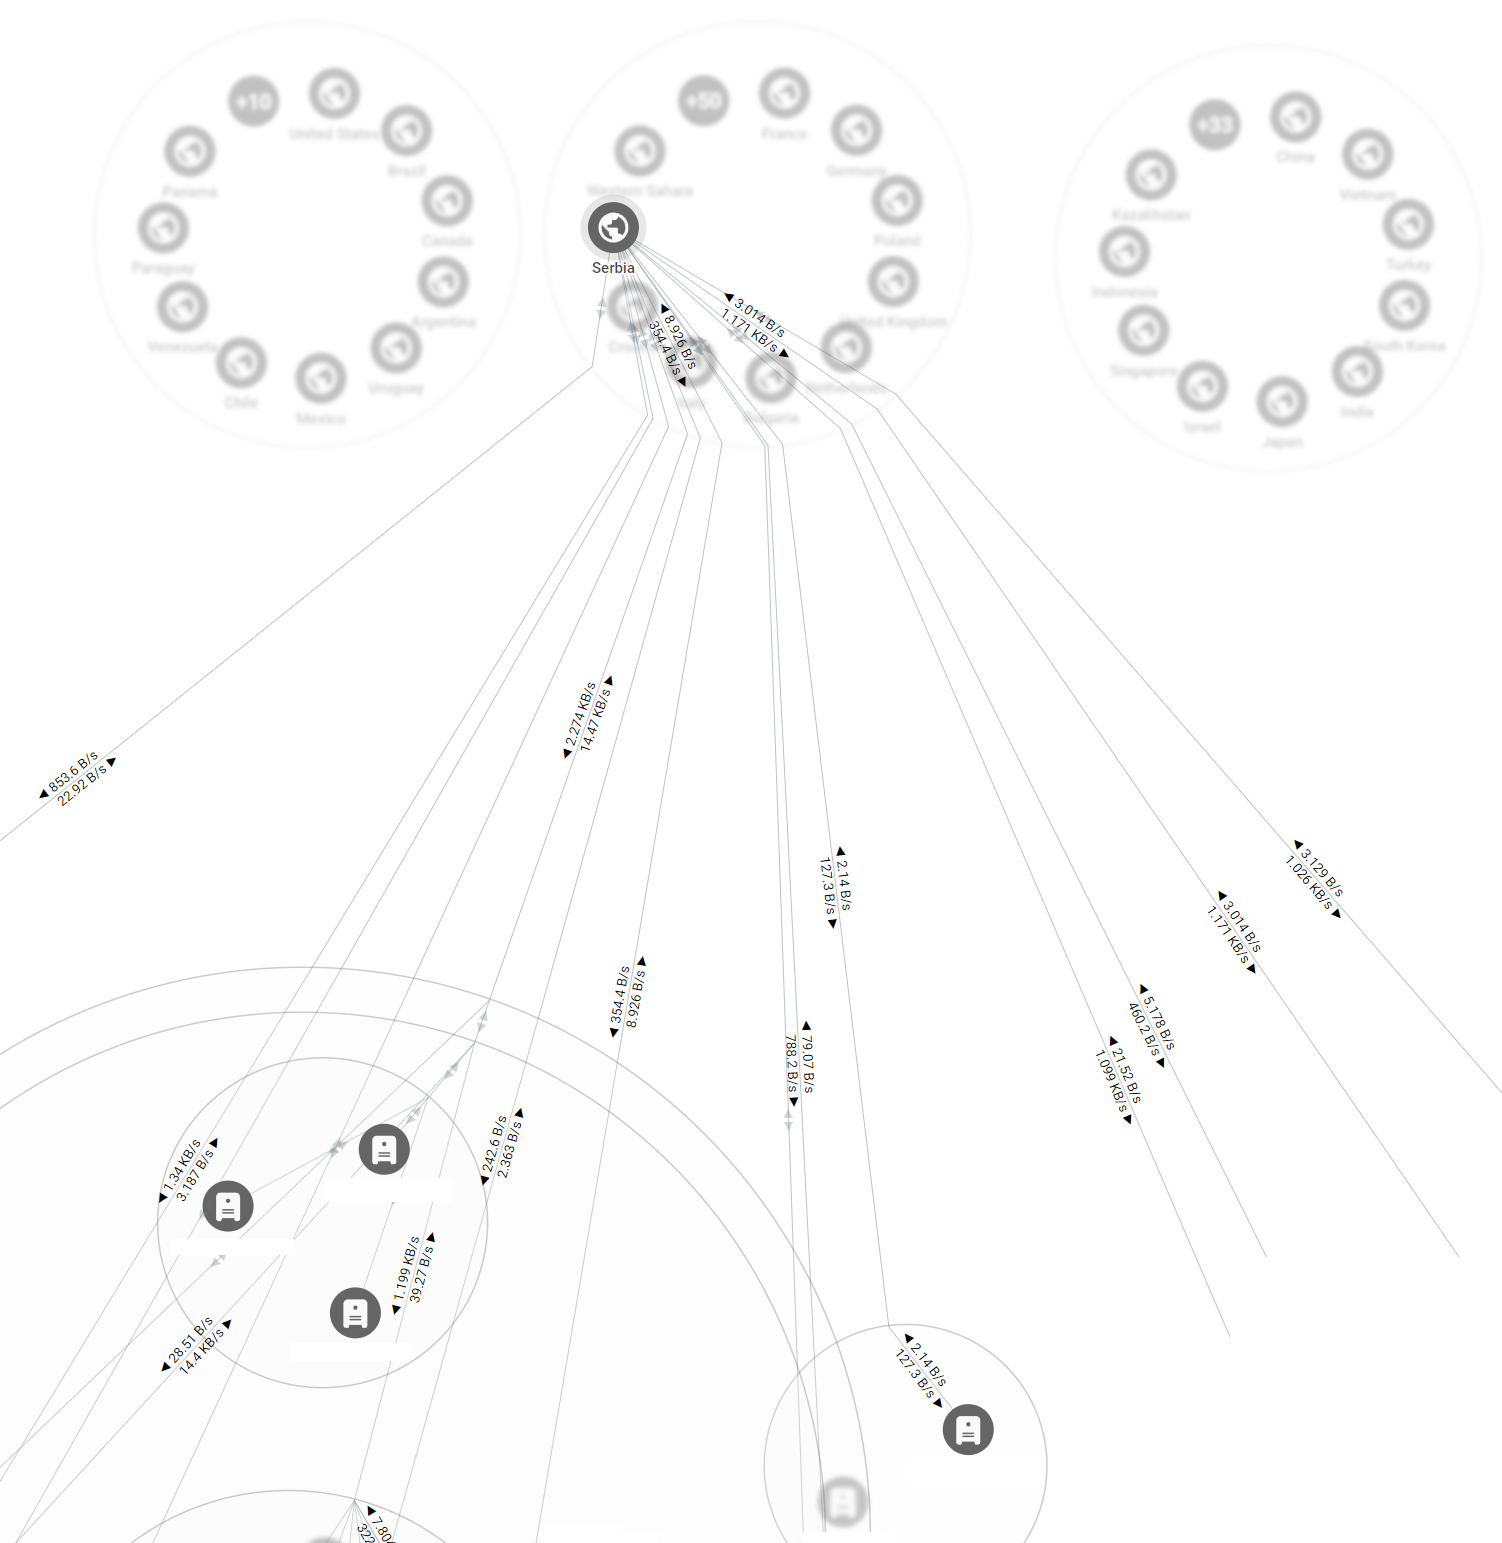
One of the most powerful tools for visualizing the behavior of complex subsystems is GCP's Network Intelligence Center's Network Topology mapping system that makes it possible to visualize an entire system, looking across its entire global network flows. Here we show a single instantaneous snapshot of network flows to and from Serbia through a small specialized GDELT GEN5 fleet management subsystem as it is just beginning to spin up for a regression test (at this instant it had just initialized status for 93 countries), allowing us to watch how each component comes online and to observe how its global and geographic self-healing behaviors perform as we put it through various degradation tests.

