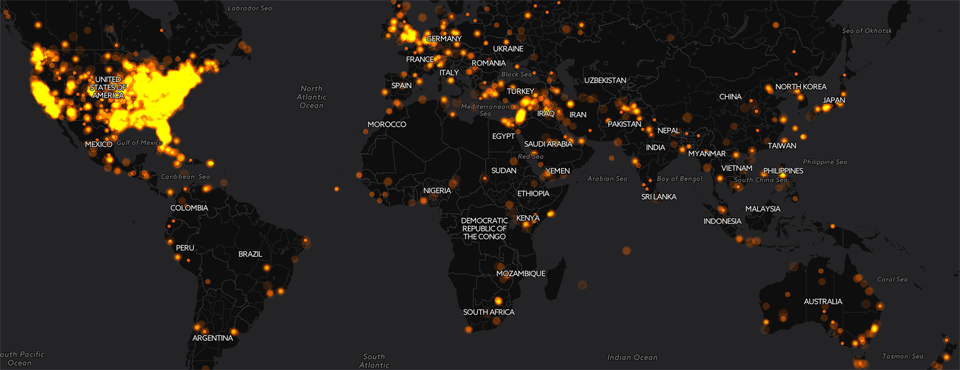
Kalev's latest Forbes piece features a city/landmark-level animation mapping every location on earth mentioned at least 3 or more times in a given day on American television news shows monitored by the Internet Archive over the last 6 years. In the space of 15 seconds you will see 6 years of television go by, with each frame of the animation representing one day in the life of American television.
Creating this map required just a single line of code in Google BigQuery and just 7.3 seconds to complete and just a few more seconds to import directly into CartoDB for the final interactive clickable map.
select day, lat, long from (
SELECT day, lat, long, COUNT(*) as cnt
FROM (
select CONCAT( substr(string(DATE),0,4), '-', substr(string(DATE),5,2), '-', substr(string(DATE),7,2)) day, ROUND(FLOAT(REGEXP_EXTRACT(SPLIT(V2Locations,';'),r'^[2-5]#.*?#.*?#.*?#.*?#(.*?)#.*?#')),2) as lat, ROUND(FLOAT(REGEXP_EXTRACT(SPLIT(V2Locations,';'),r'^[2-5]#.*?#.*?#.*?#.*?#.*?#(.*?)#')),2) AS long
FROM [gdelt-bq:gdeltv2.iatvgkg]
where DATE>200900000000000
)
where lat is not null and long is not null and abs(lat) < 80 and (abs(lat) > 0 or abs(long) > 0)
group by day, lat,long
) where cnt >= 3
Click on the map below to launch the interactive zoomable version.
