Update (12/27/2020): A deep dive explanation on these trends is now available.
Using our massive new Television News Advertising Inventory Files (AIF) Captioning Time dataset, we wanted to see whether advertising makes up more or less of the total daily airtime across CNN, MSNBC and Fox News today than it did a decade ago and whether there have been any large-scale systematic trends.
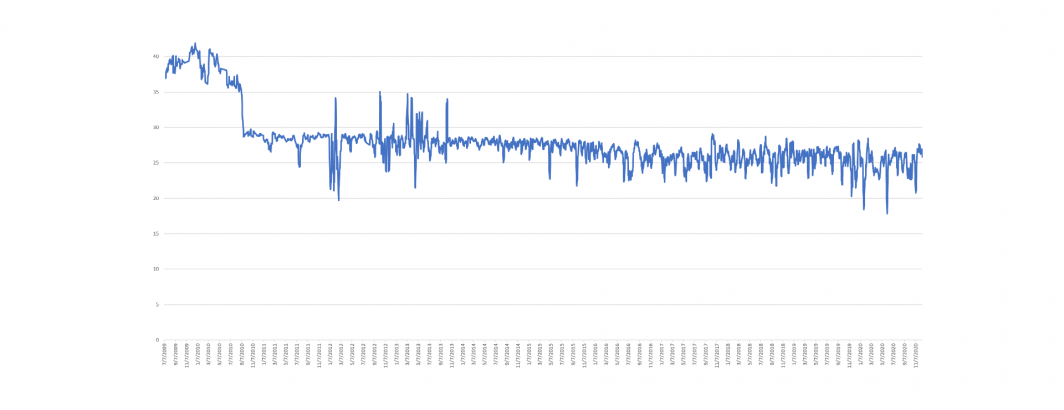
The graphs below show the total daily airtime determined to be "advertising" or "uncaptioned" (which is typically advertising in the case of these three channels) by day over the past decade using a 7-day rolling average to smooth the data.
NOTE that all three channels transitioned from East Coast collection to West Coast collection around 2011 and there was an overlap period that may partially explain some of the results below (we did not exclude overlapping collection), but there are a number of unusual results in the graphs below that will require further research.
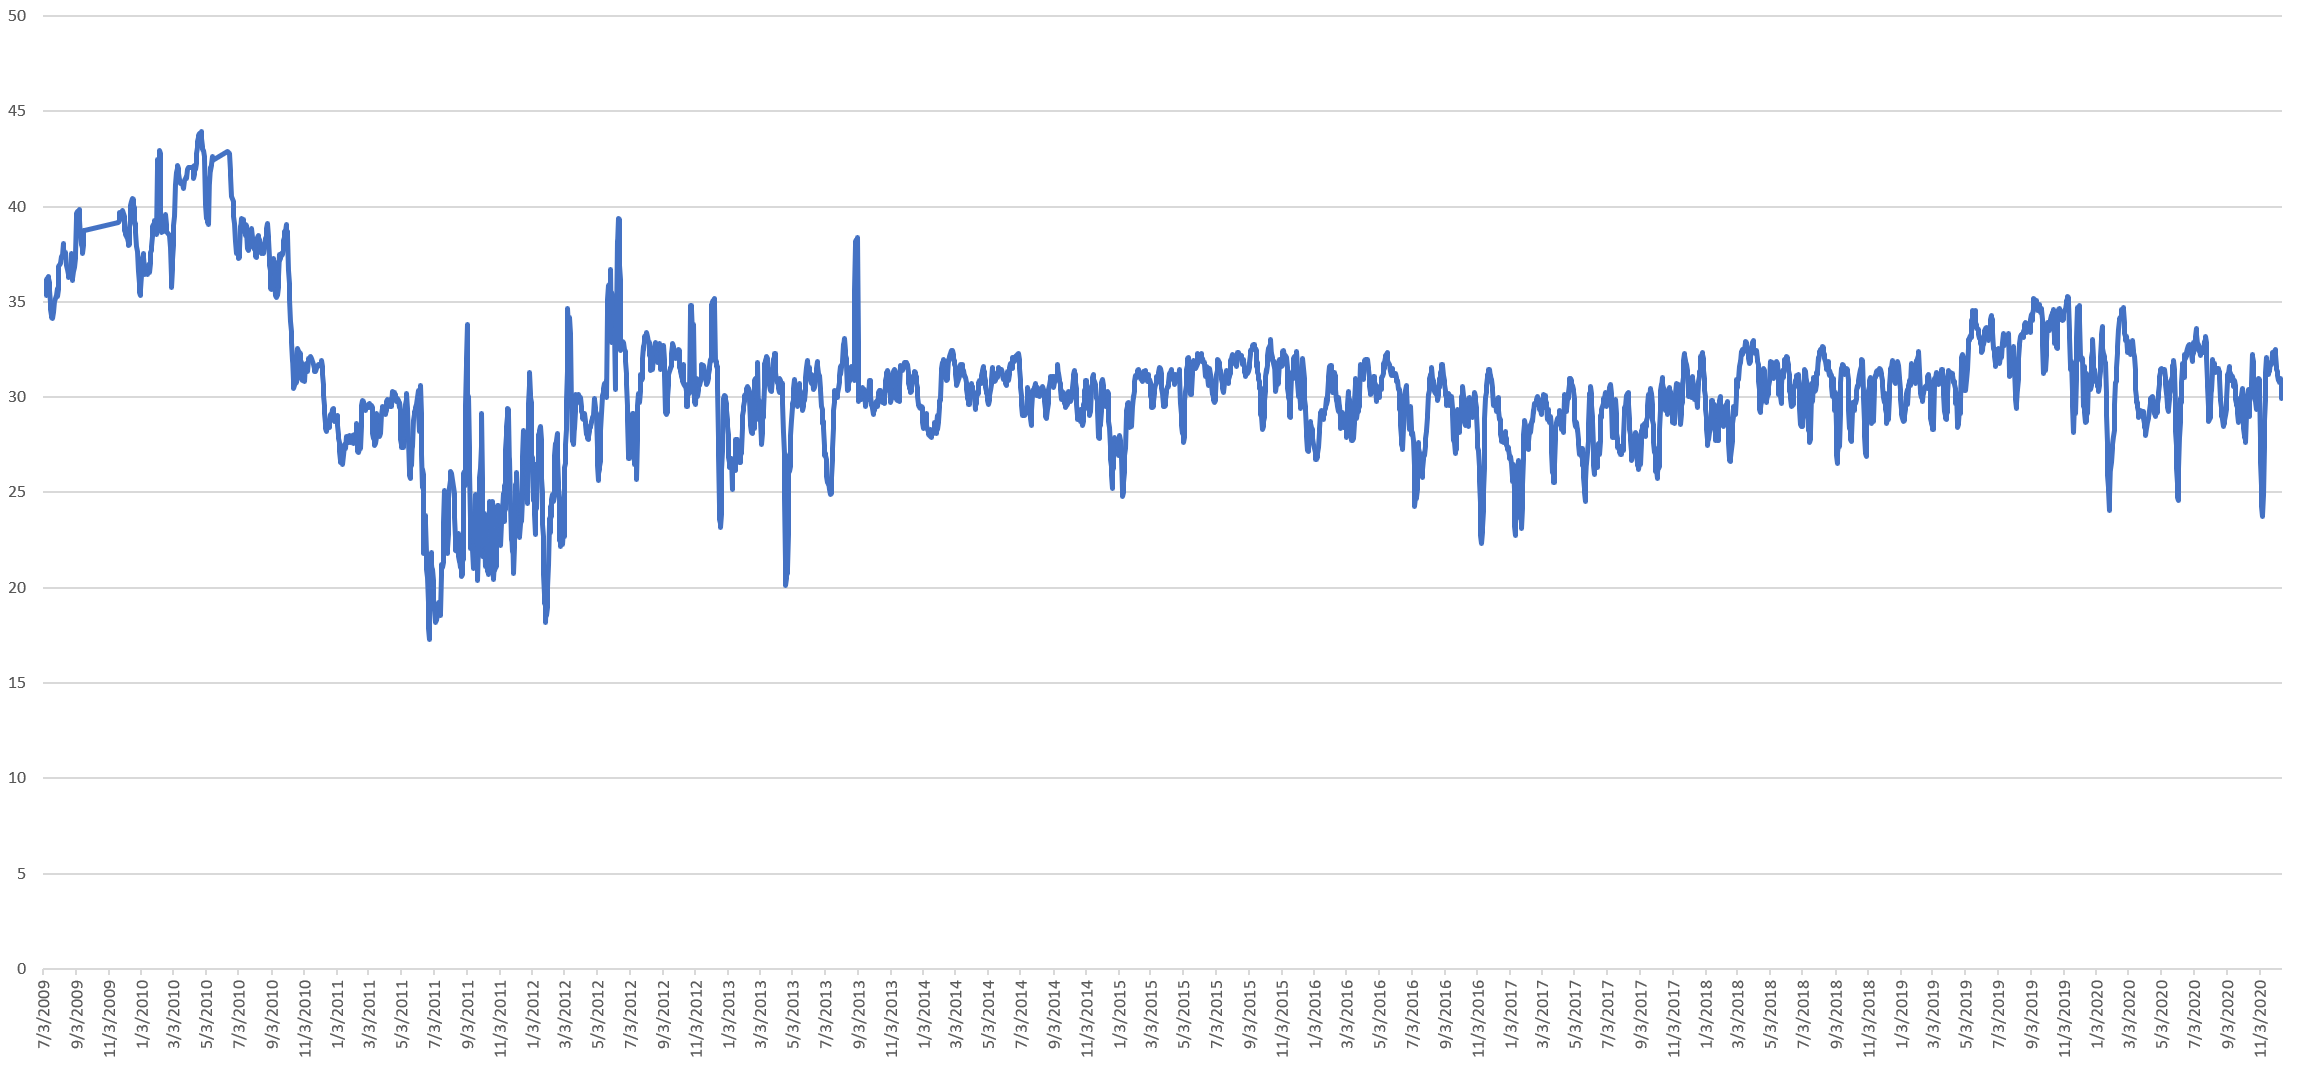
CNN
The 2009-2011 portion of this graph may be partially explained by the transition from East to West Coast collection. The graph is fairly stable from 2013-present, though the sharp increase in mid-2019 requires further research to determine whether it is a data artifact or a legitimate surge in advertising airtime.
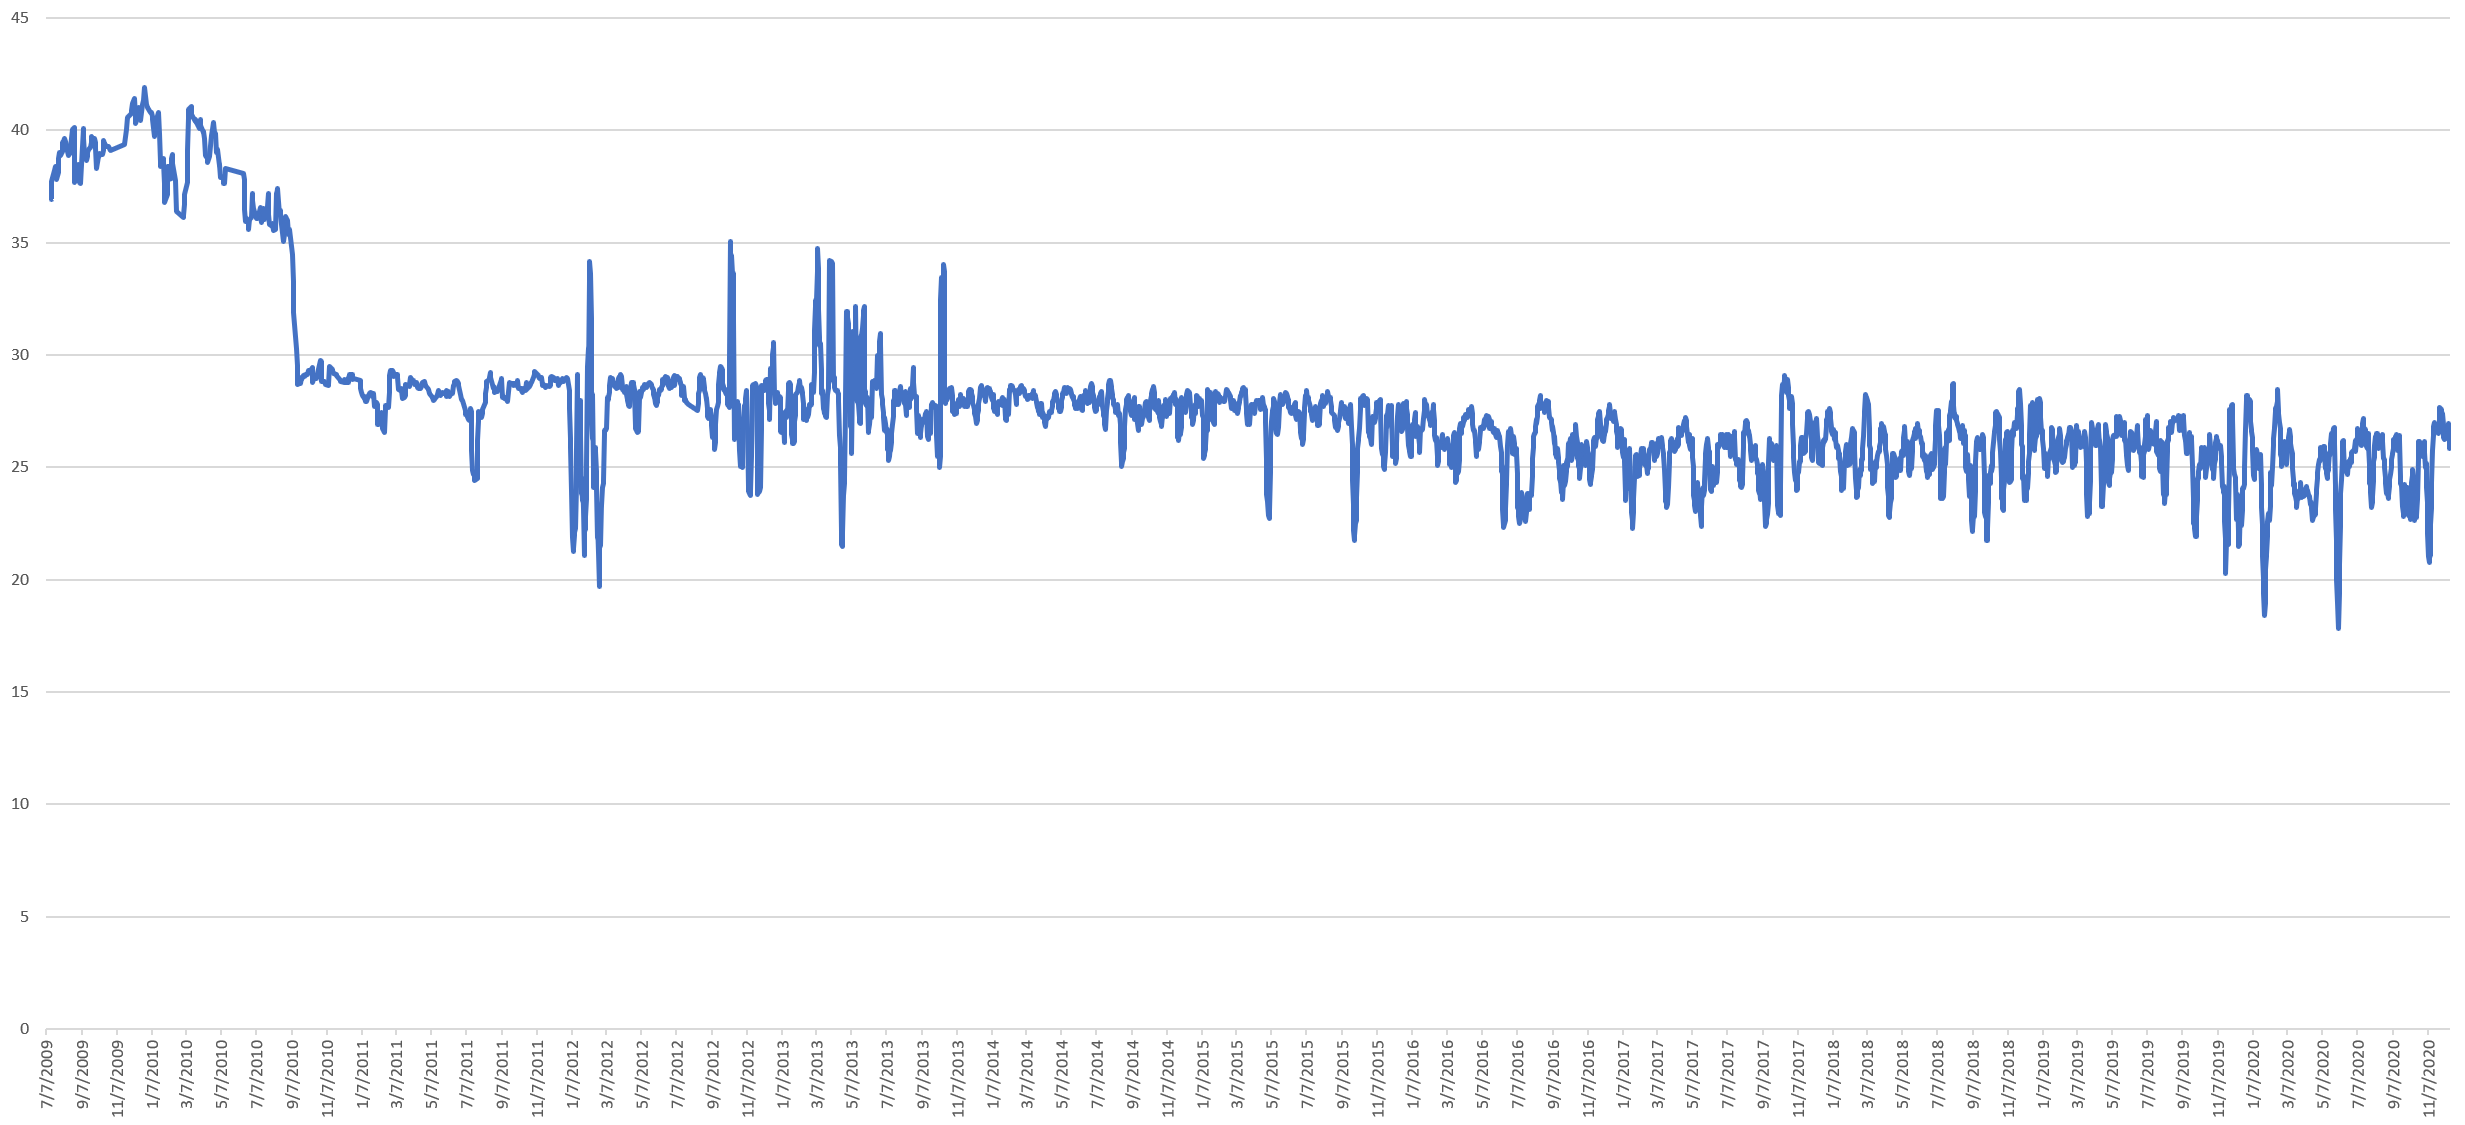
MSNBC
As with CNN, the 2009-2013 period is a transition period. Interestingly, advertising airtime appears to decrease steadily from 2013 through 2016. Again, this will require further research to confirm.
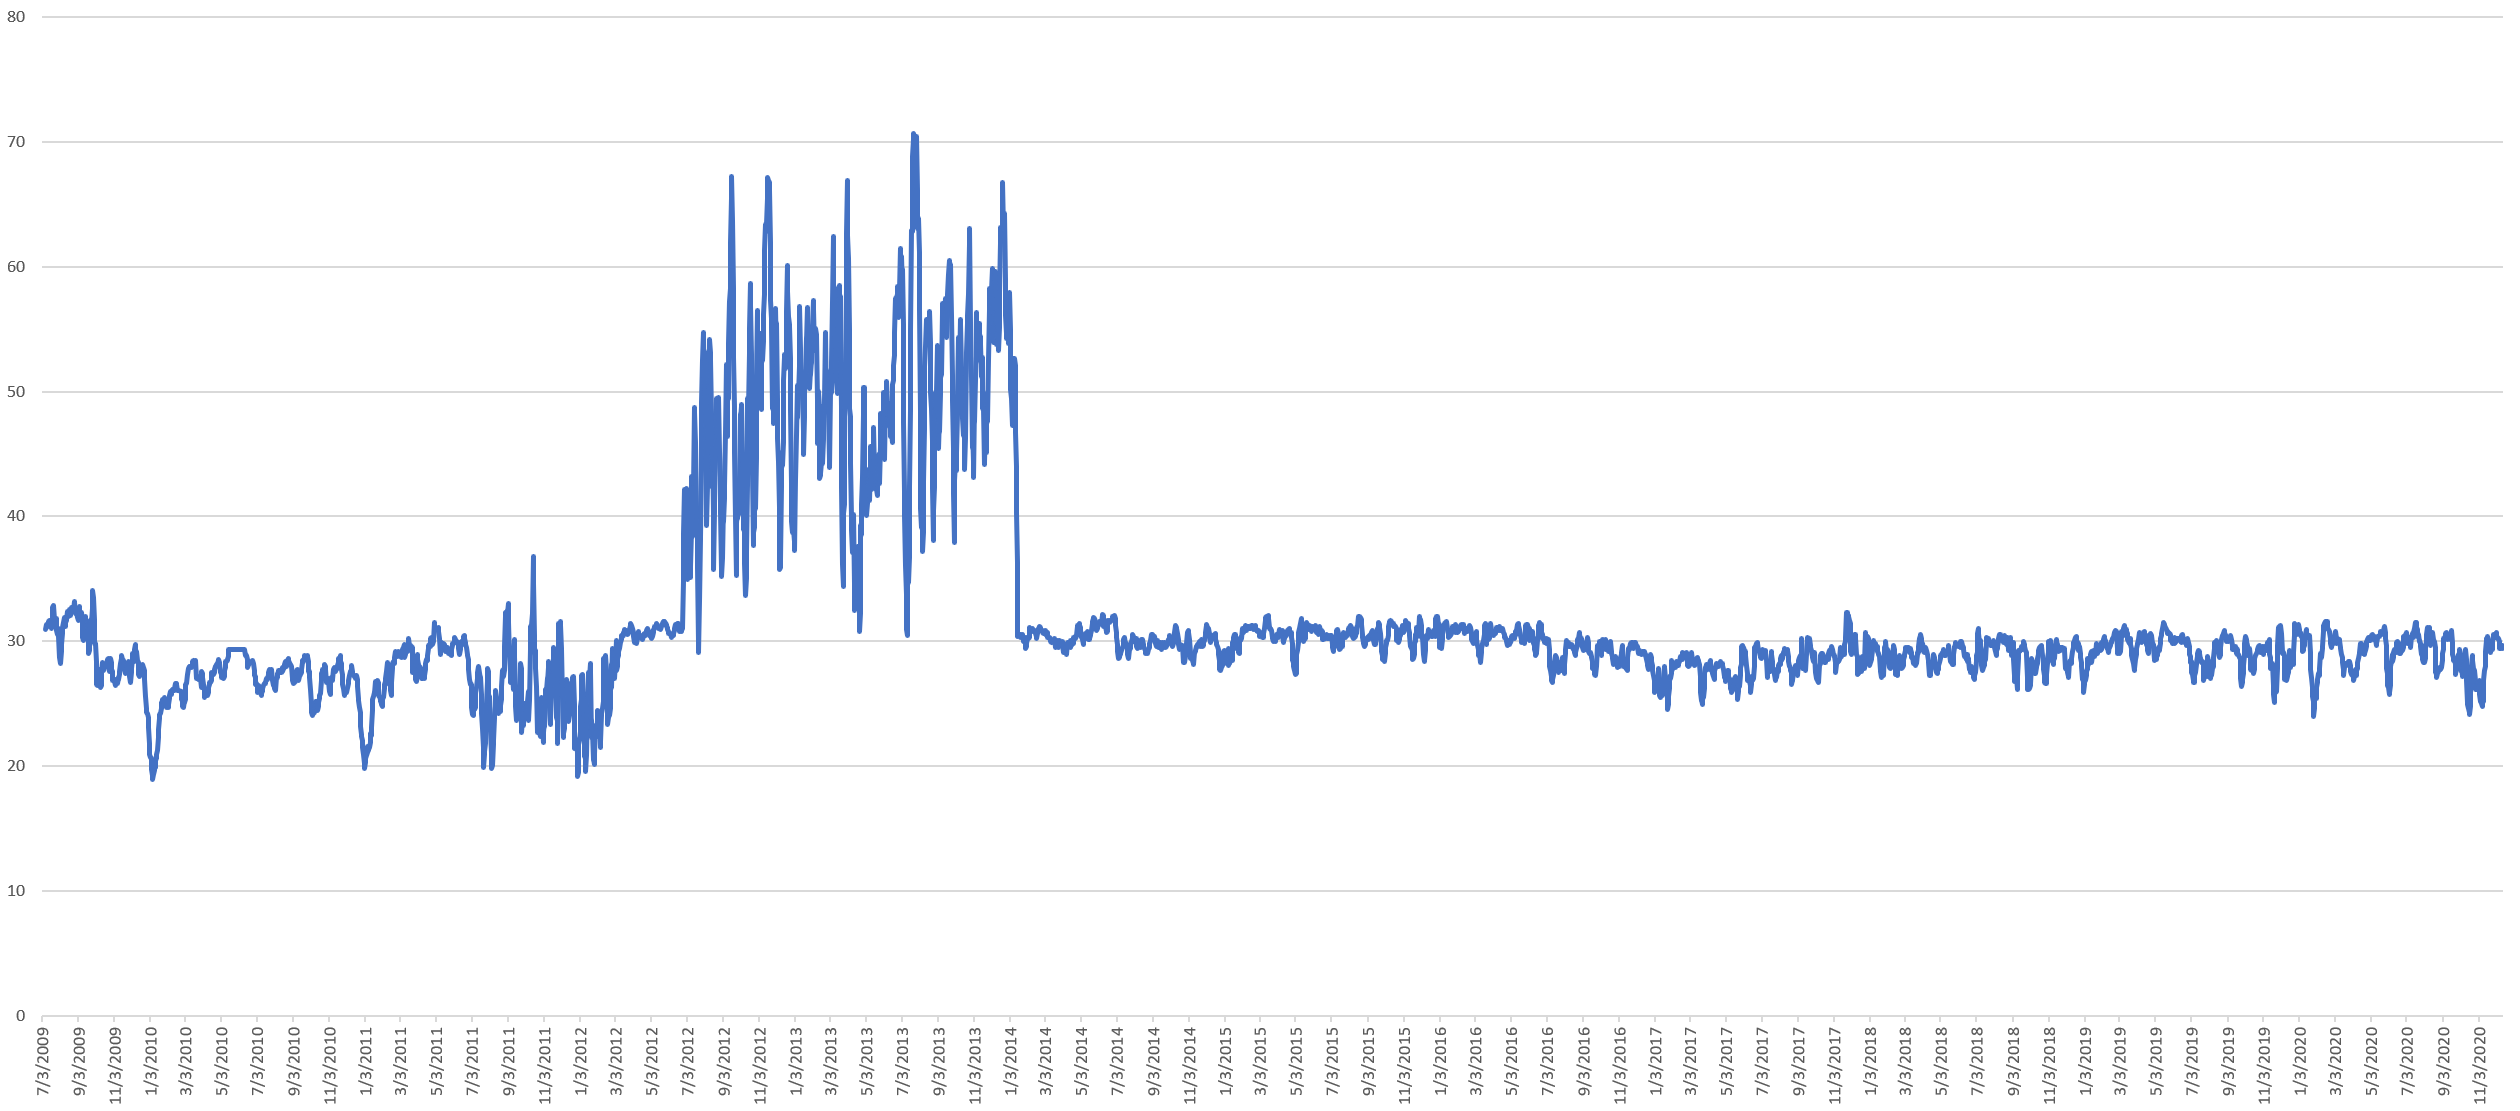
Fox News
The 2012-2013 period appears to be driven by an overlap between East and West Coast collection, though it is unclear why this would cause such a marked surge in the results.
TECHNICAL DETAILS
The AIF dataset is not yet available in BigQuery (we will be loading it in as soon as the historical backfiles have completed processing), but in the meantime we used the following query with a temporary copy constructed from the public AIF files:
SELECT DAY, SUM(ADSEC) ADSEC, SUM(TOTSEC) TOTSEC, SUM(ADSEC)/SUM(TOTSEC)*100 PERCADTIME FROM (
SELECT DATE(date) DAY, count(1) ADSEC, 0 TOTSEC FROM `[TEMPTABLE]` where station='CNN' and (type='ADVERTISEMENT' OR type='UNCAPTIONED') AND DATE(date) >= "2009-07-02" group by DAY
UNION ALL
SELECT DATE(date) DAY, 0 ADSEC, count(1) TOTSEC FROM `[TEMPTABLE]` where station='CNN' AND DATE(date) >= "2009-07-02" group by DAY
) group by DAY having TOTSEC>=64800 order by DAY ASC
We're tremendously excited to see the kinds of new research into advertising and trends trends in these results, as well as the ability to remove advertising content from news analyses so as to not skew results.