How did news coverage of Covid-19 spread across the world? Using our massive new Covid-19 Geographic News Database, it takes just a single SQL query with BigQuery to compile a time-series geographic dataset and just a few seconds to turn that data into an interactive time series animated geographic visualization in the incredible online mapping platform Carto for instant visualization!
To create the map below, we searched the new geographic database for all locations mentioned within 600 characters of "Coronavirus", "Covid-19" and "Sars-Cov-19" from January 1, 2020 through April 6, 2020. The disease was first known simply as a generic "coronavirus" meaning some of the earliest coverage includes discussion of other coronaviruses given that 2019 was a year of numerous health crises. Among the earliest locations in the United States to be mentioned heavily include designated screening airports and policymaker discussion. Most early location mentions involve hypothetical discussions such as theoretical discussions of whether the new virus could possibly spread to various cities and countries. Over time, locations include those announcing mitigation measures like quarantines and the creation of task forces.
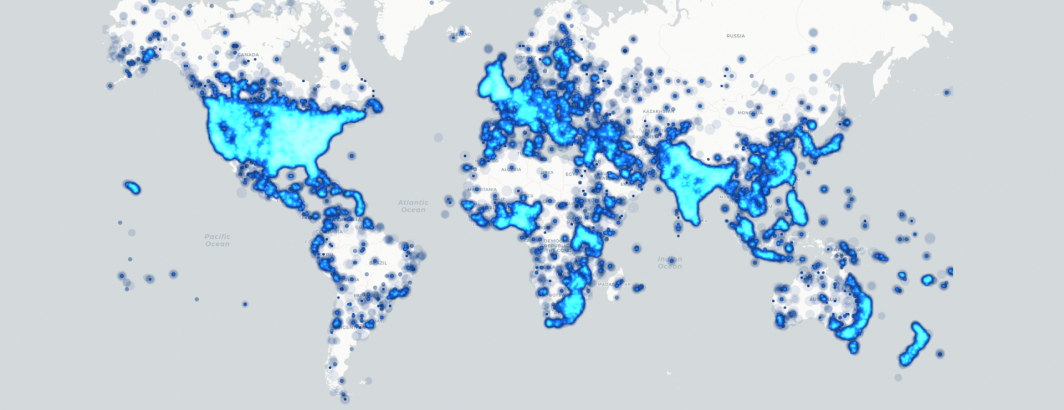
Thus, it is critical to emphasize that the map below is NOT an infection map, it is a map of locations mentioned in Covid-19 and related news coverage over time and offers a sense of the geographic timeline of media awareness of the disease as it spread across the world. All locations represent centroids and are the results of automated algorithms that are imperfect and thus there is a degree of error to the map below.
TECHNICAL DETAILS
Creating this map was as simple as a single line of SQL in BigQuery, with the result mapped in Carto using its "Torque" map layer.
SELECT DATE(DateTime) day, Lat, Lon, count(1) NumArts FROM `gdelt-bq.covid19.onlinenewsgeo` where (ContextualText like '%covid 19%' OR ContextualText like '%coronavirus%' OR ContextualText like '%sars cov 19%') group by Lat, Lon, day