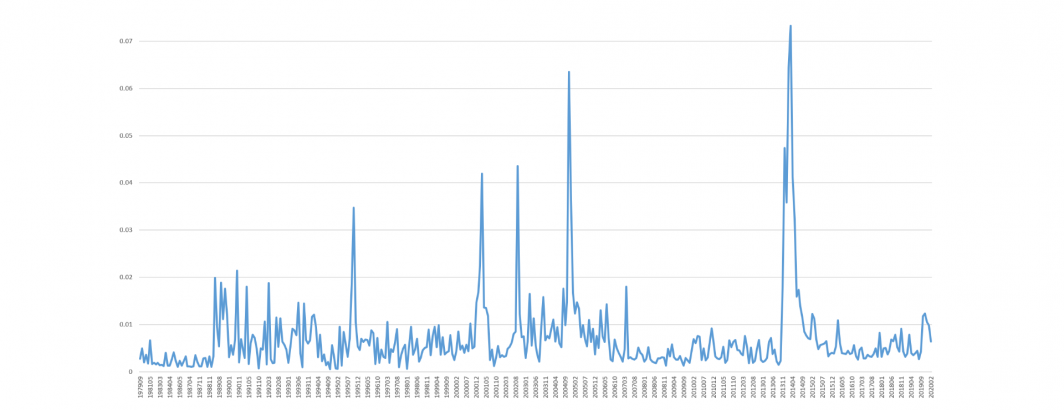
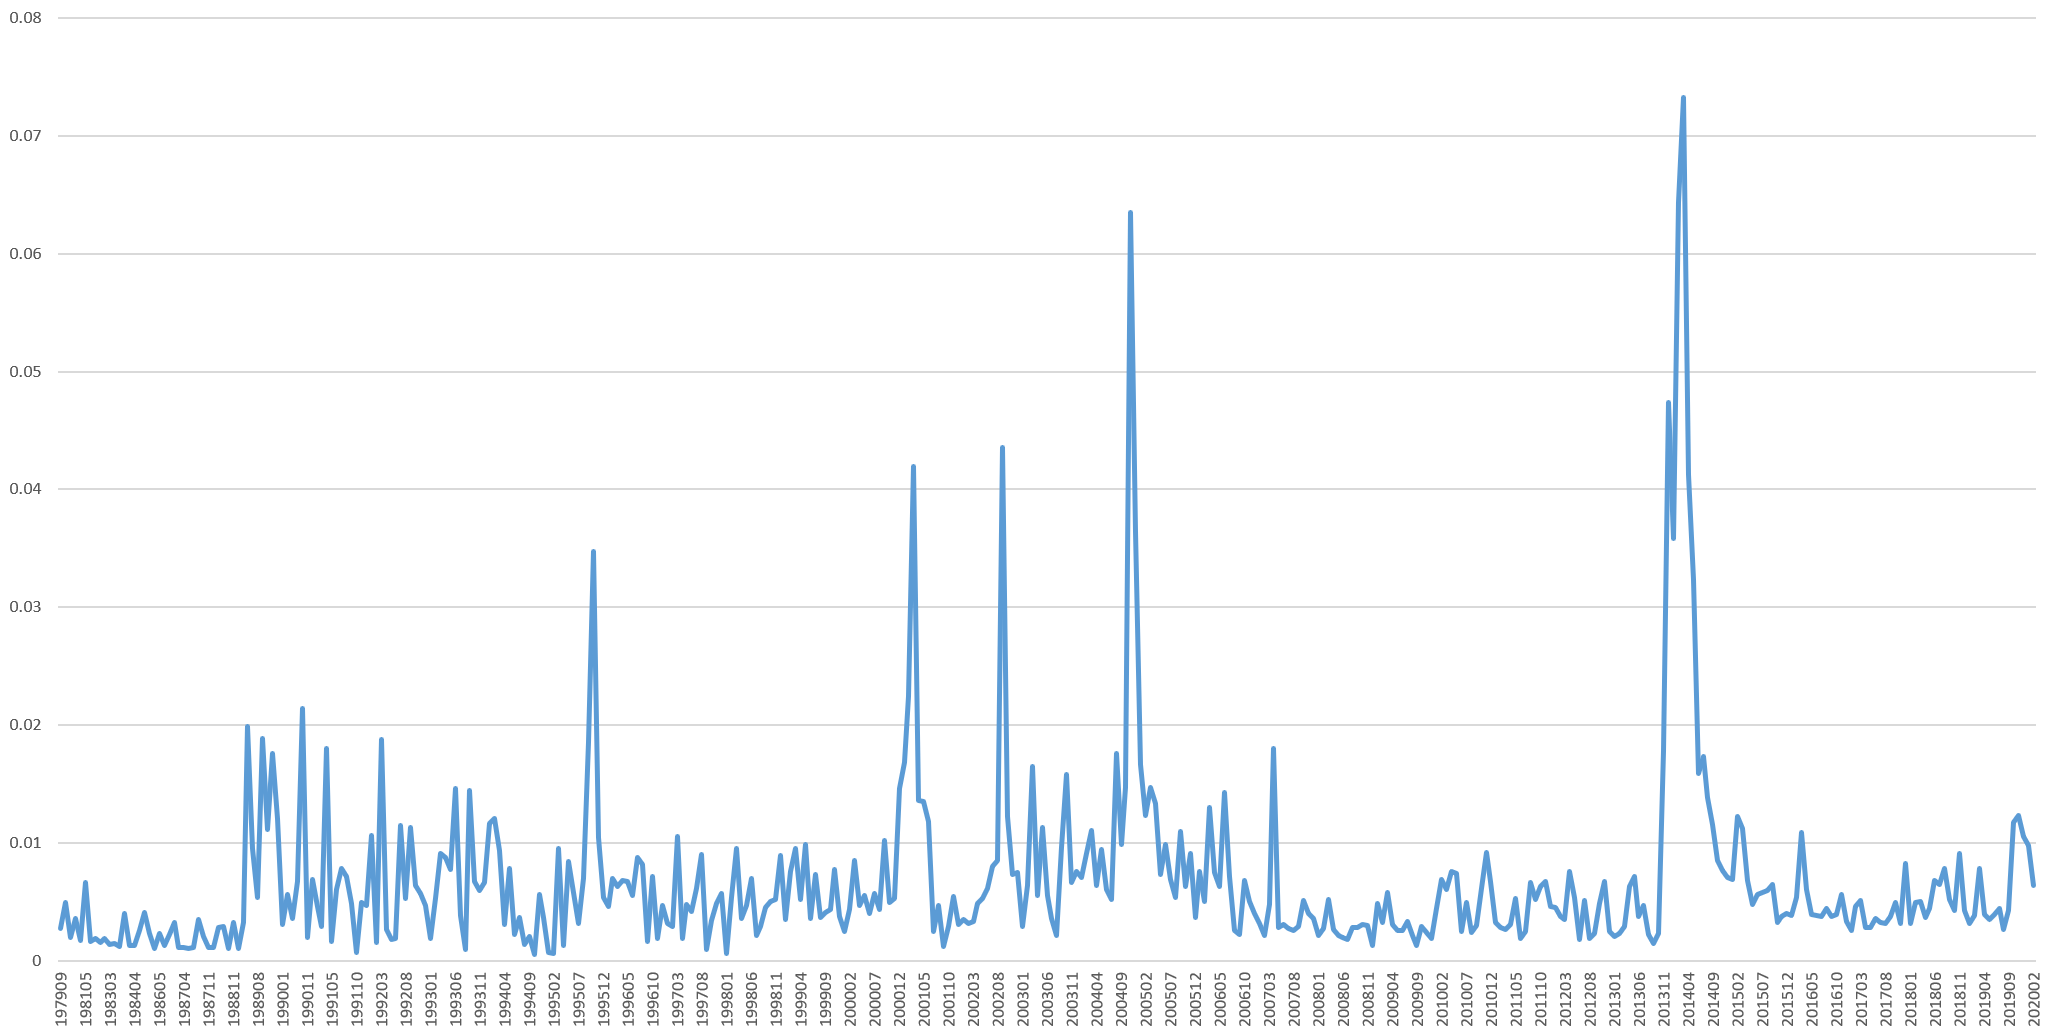
Using the new modernized example Standard SQL queries we posted earlier today, what can we learn about the monthly protest intensity of Ukraine over the past 40 years?
Using a single line of SQL it takes just 4.5 seconds to arrive at the final timeline below (Y axis is effectively the "protest intensity" of the country). The collapse of the Soviet Union, the 2004 Orange Revolution and the 2013-2014 Euromaidan Revolution are all clearly visible in the data, as are a number of other periods of elevated civil mobilization. The ability to chart a country's 40-year history with a single query reminds us of the power of quantitative analysis of human history.
TECHNICAL DETAILS
Computing the timeline above took just a single line of SQL:
SELECT MonthYear, Perc from (
SELECT ActionGeo_CountryCode, EventRootCode, MonthYear, ( COUNT(1) / sum(count(*)) OVER(PARTITION BY MonthYear) ) * 100 Perc FROM `gdelt-bq.full.events` GROUP BY ActionGeo_CountryCode, EventRootCode, MonthYear
) WHERE ActionGeo_CountryCode='UP' and EventRootCode='14' ORDER BY MonthYear ASC