When we first launched the GDELT Analysis Service, one of the early visualizations we released was our Conflict Timeline, which graphed the stability of a country at daily resolution in a seismograph-like display that made major events and overall trends immediately apparent.
When the brand-new GDELT Analysis Service 2.0 debuts later this spring, that display will support a range of new capabilities that we are tremendously excited about.
We will also be building these graphs into the forthcoming GDELT Global Trends Dashboard, allowing you to click on any country to see a live-updated version of this graph placing current events into their historical context.
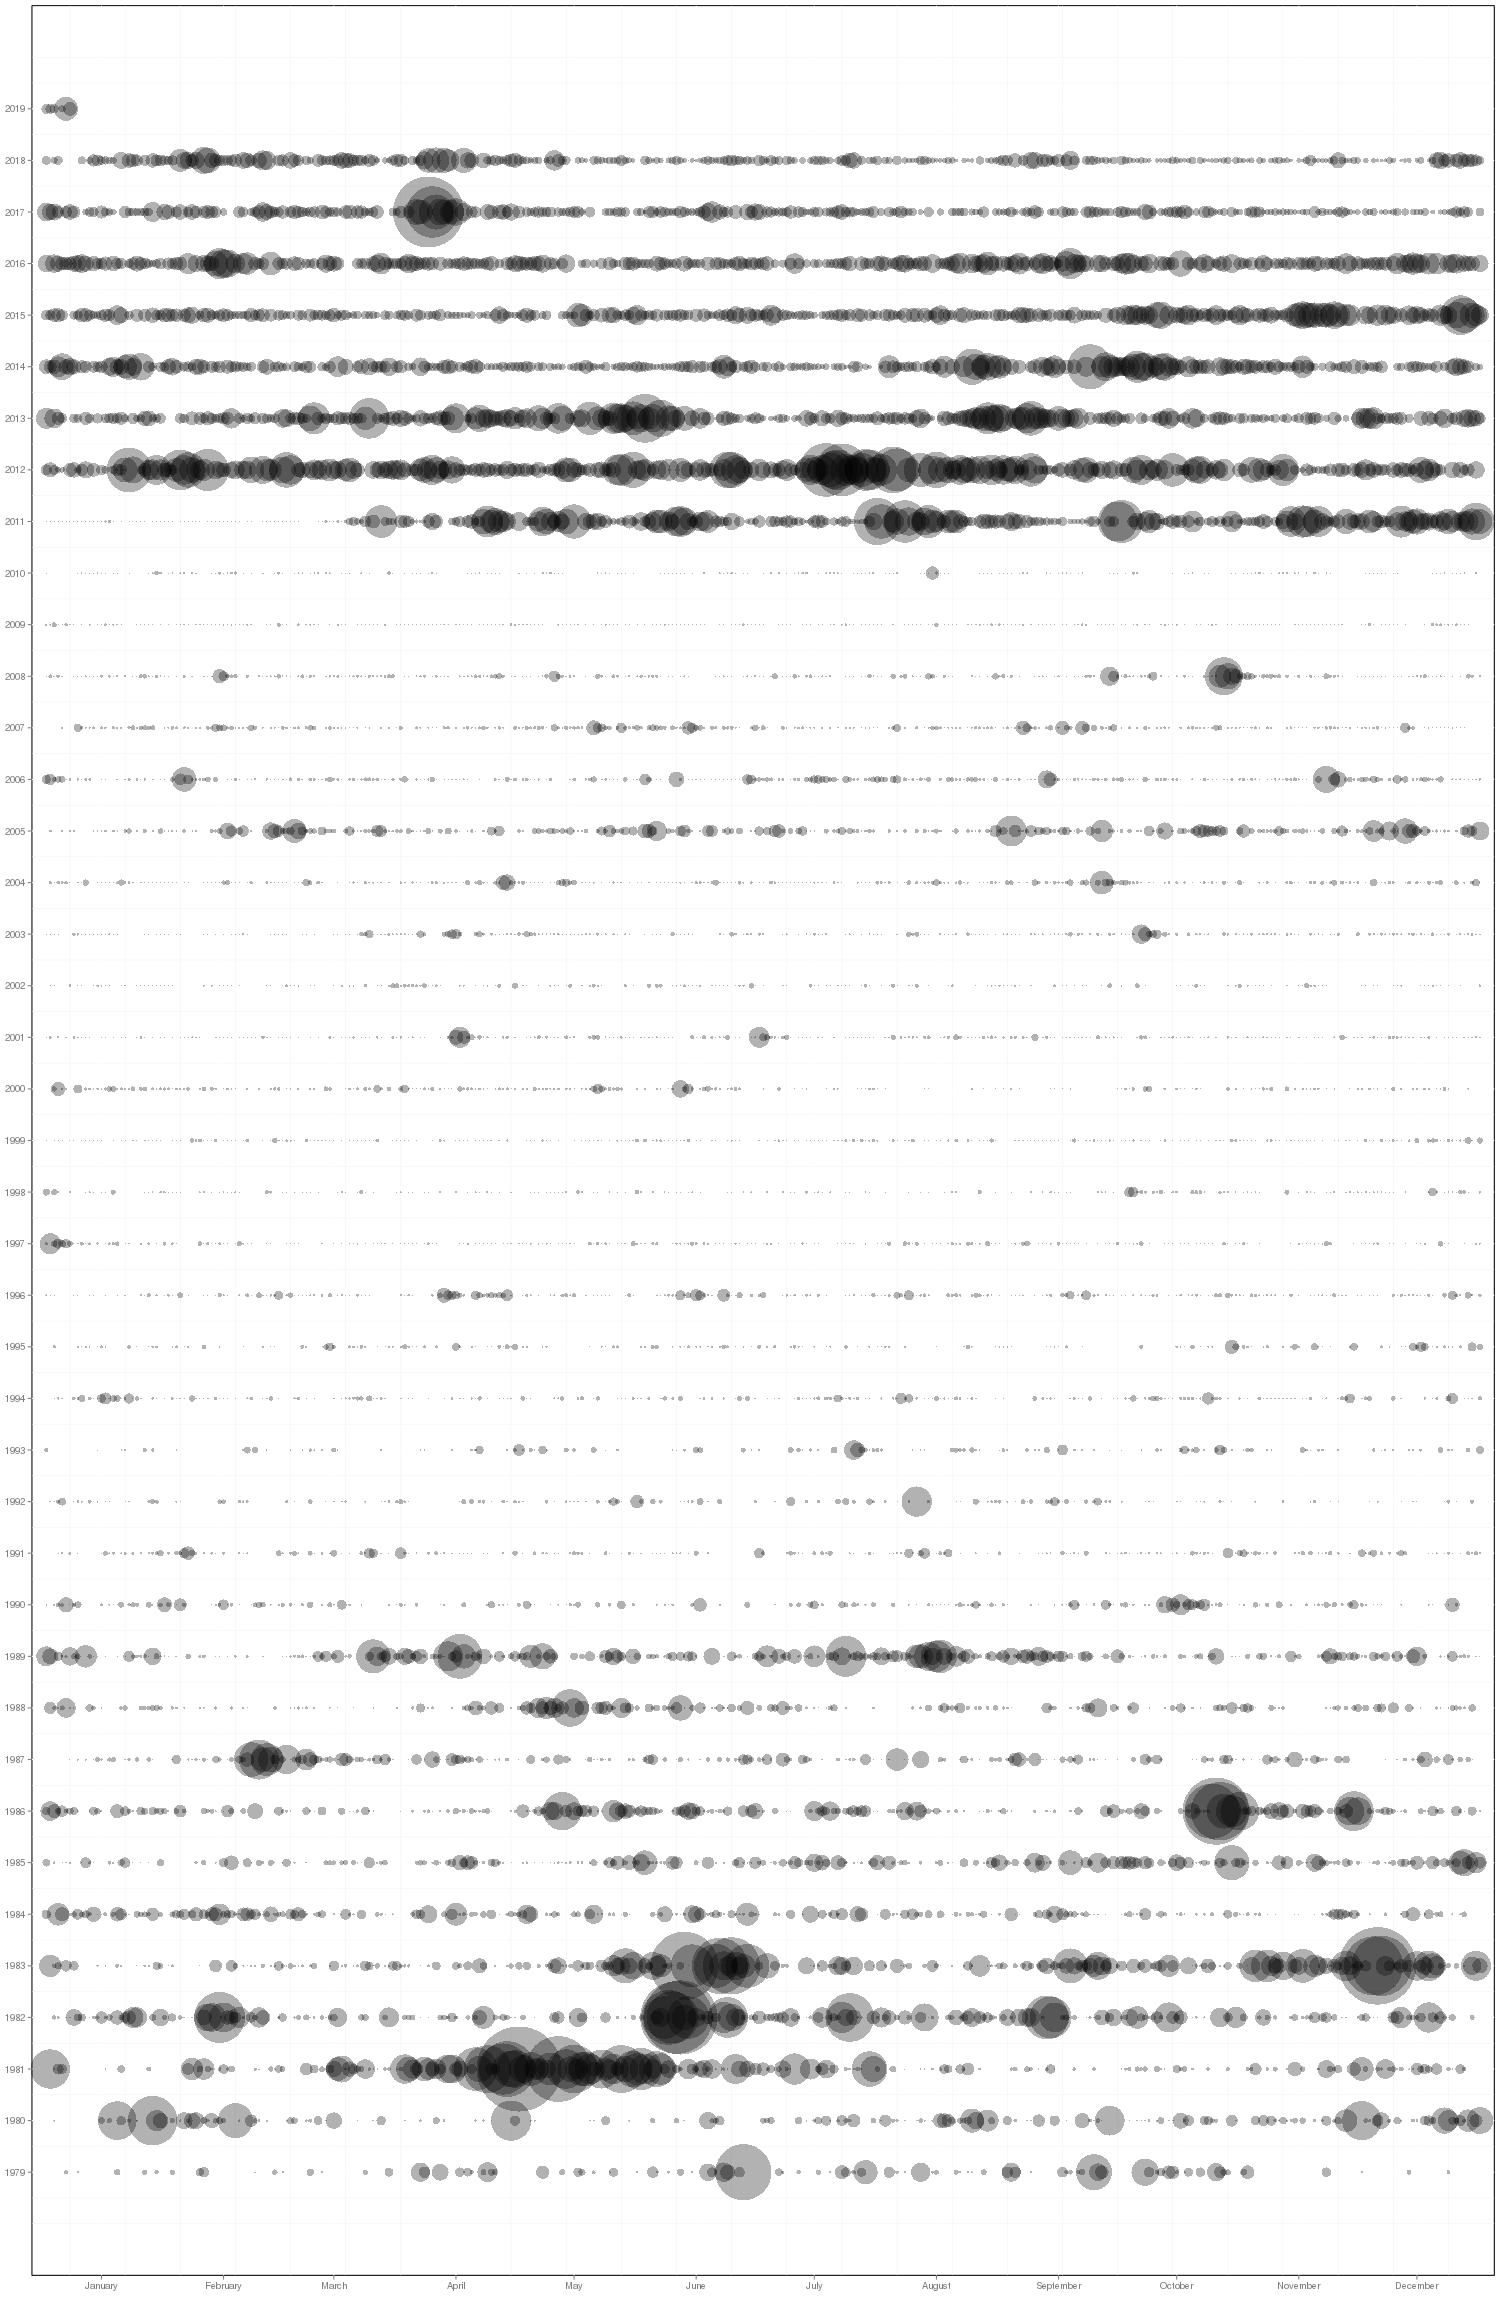
Here's the graph for Syria, showing the intensity of Material Conflict by day from January 1, 1979 through yesterday. In a single image we can see 40 years of Syrian history, showing a period bookended by violence, but with a long period of peace in between, reminding us that the countries capturing the headlines today for violence were not always that way.
Stay tuned for some powerful new visualizations coming this spring!