Continuing our series using BigQuery to analyze our Bigtable-based GCS digital twin, how can we use this same approach to summarize all of the television news coverage held by the Internet Archive's TV News Archive from Belarusian, Russian and Ukrainian channels? The majority of the Archive's coverage from those channels (Belarus 24, Channel 1, NTV, Russia 1, Russia 24, Russia Today and Espreso) begins with the Russian invasion of Ukraine in 2022, but select channels were monitored prior to that, with Russia Today stretching back to 2010. How might we repeat our earlier SQL analysis, but filter it to consider only these 7 channels?
Adding a single WHERE clause to our SQL is all that's needed to perform the exact same analysis on just content from those seven channels in the three countries. In all, there are 364,431 news broadcasts in the collection, totaling 753 million seconds (12.5M minutes / 209K hours) of airtime that together take 118TB of storage, with 111 trillion pixels analyzed by the Visual Explorer.
Modifying our earlier SQL to analyze just a subset of channels is as trivial as adding a WHERE clause:
SELECT DATE, COUNT(1) totShows, ROUND(SUM(sec)) totSec, ROUND(SUM(bytes)) totBytes, ROUND(SUM(pixels)) totVEPixels from (
select FORMAT_DATE('%m/%d/%Y', PARSE_DATE('%Y%m%d', substr(rowkey, 0, 8) )) AS DATE,
  CAST(JSON_EXTRACT_SCALAR(DOWN, '$.durSec') AS FLOAT64) sec,
  CAST(JSON_EXTRACT_SCALAR(DOWN, '$.sizeBytes') AS FLOAT64) bytes,
 (
    (CAST(JSON_EXTRACT_SCALAR(DOWN, '$.durSec') AS FLOAT64) / 4) *
    CAST(JSON_EXTRACT_SCALAR(DOWN, '$.height') AS FLOAT64) *
    CAST(JSON_EXTRACT_SCALAR(DOWN, '$.width') AS FLOAT64)
  ) AS pixels FROM (
  SELECT
  rowkey, ( select array(select value from unnest(cell))[OFFSET(0)]  from unnest(cf.column) where name in ('DOWN') ) DOWN
  FROM `[PROJECTID].bigtableconnections.digtwin`
 ) WHERE DOWN like '%DOWNLOADED_SUCCESS%' and substr(rowkey, 0, 8) != '00000000' and JSON_EXTRACT_SCALAR(DOWN, '$.chan') in ('1TV',' NTV', 'RUSSIA1', 'RUSSIA24', 'RT', 'ESPRESO', 'BELARUSTV')
) group by date order by date
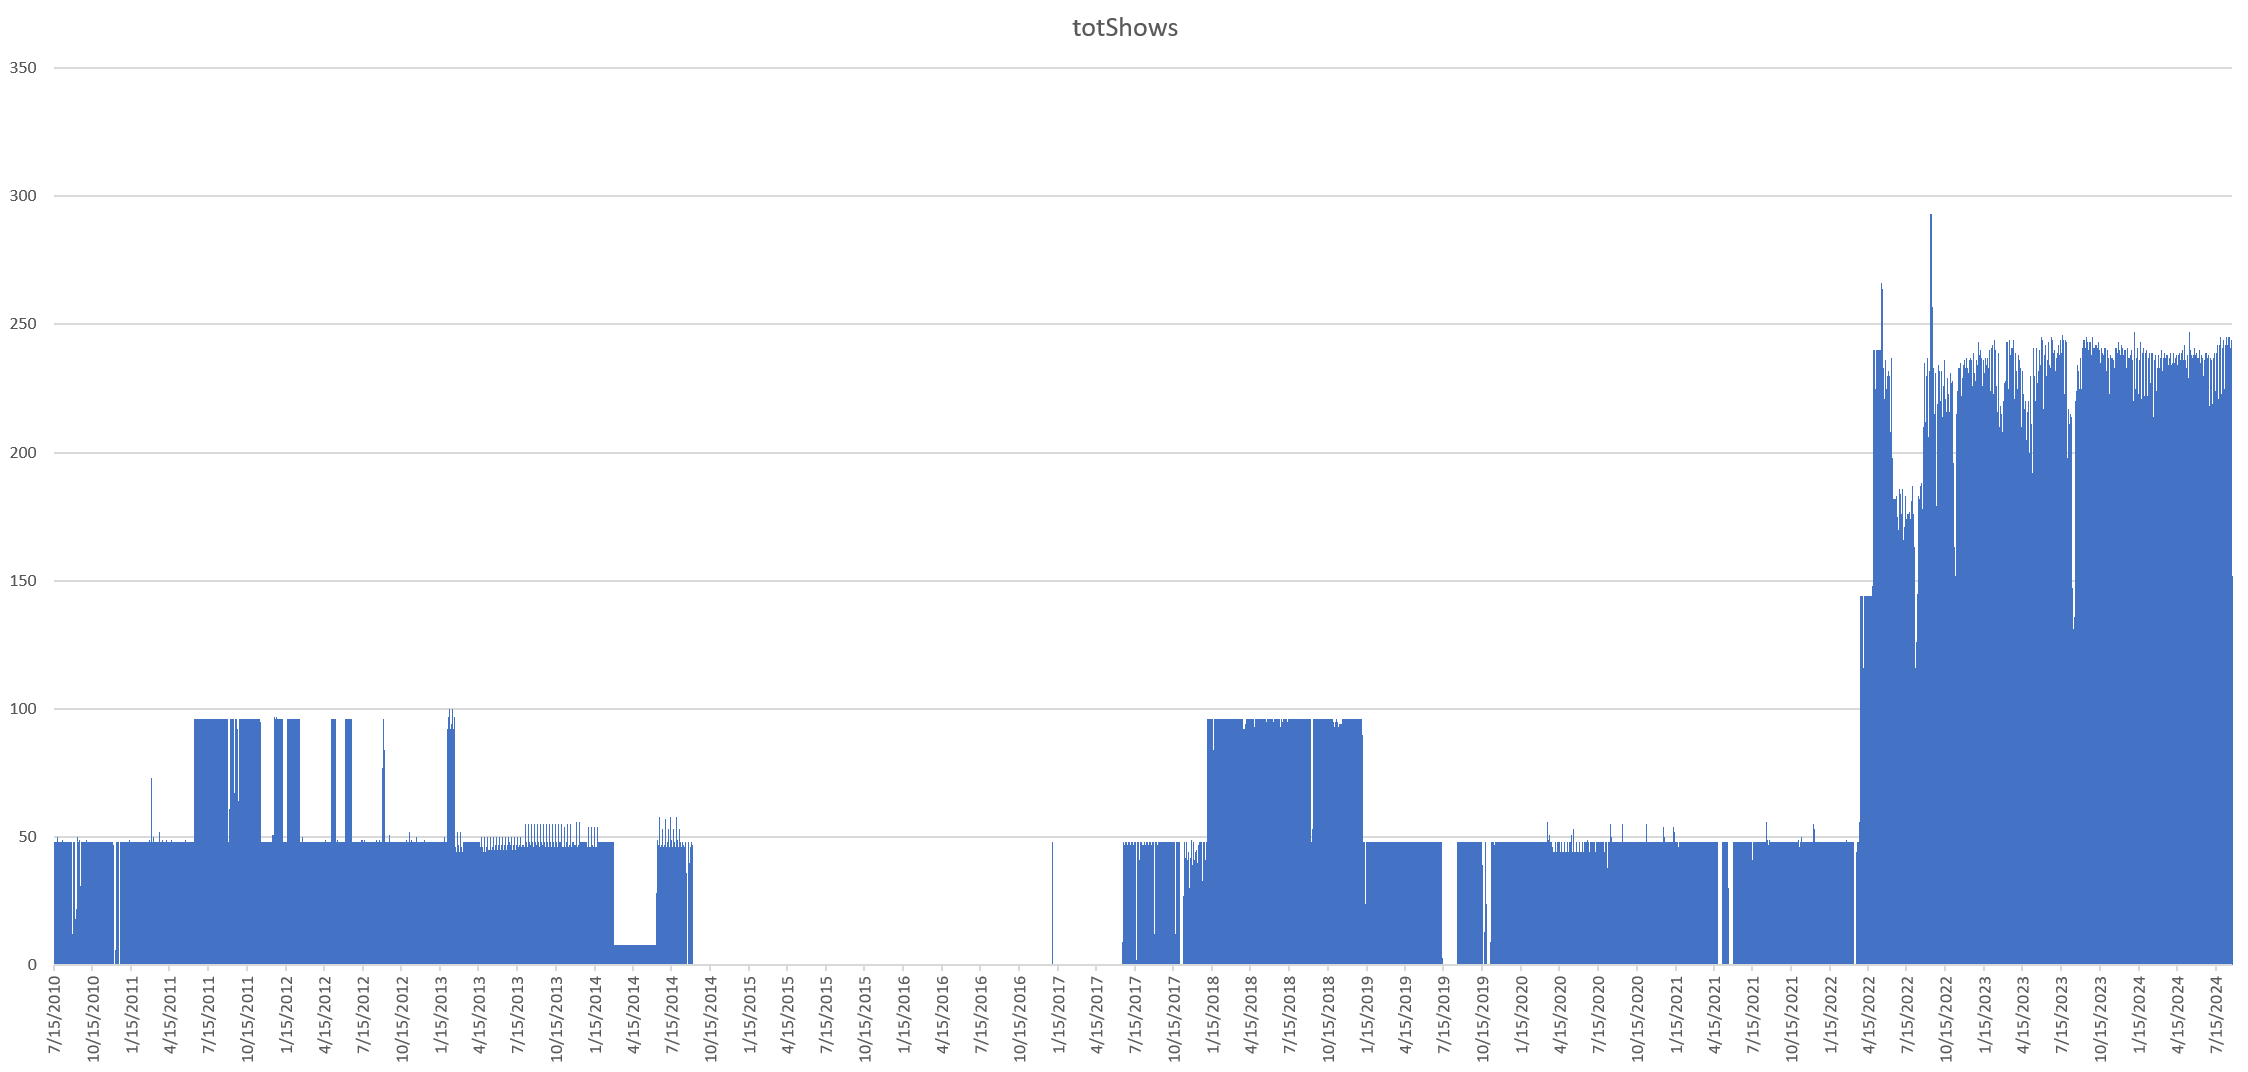
This yields the following graph of total daily shows in the collection from those seven channels:
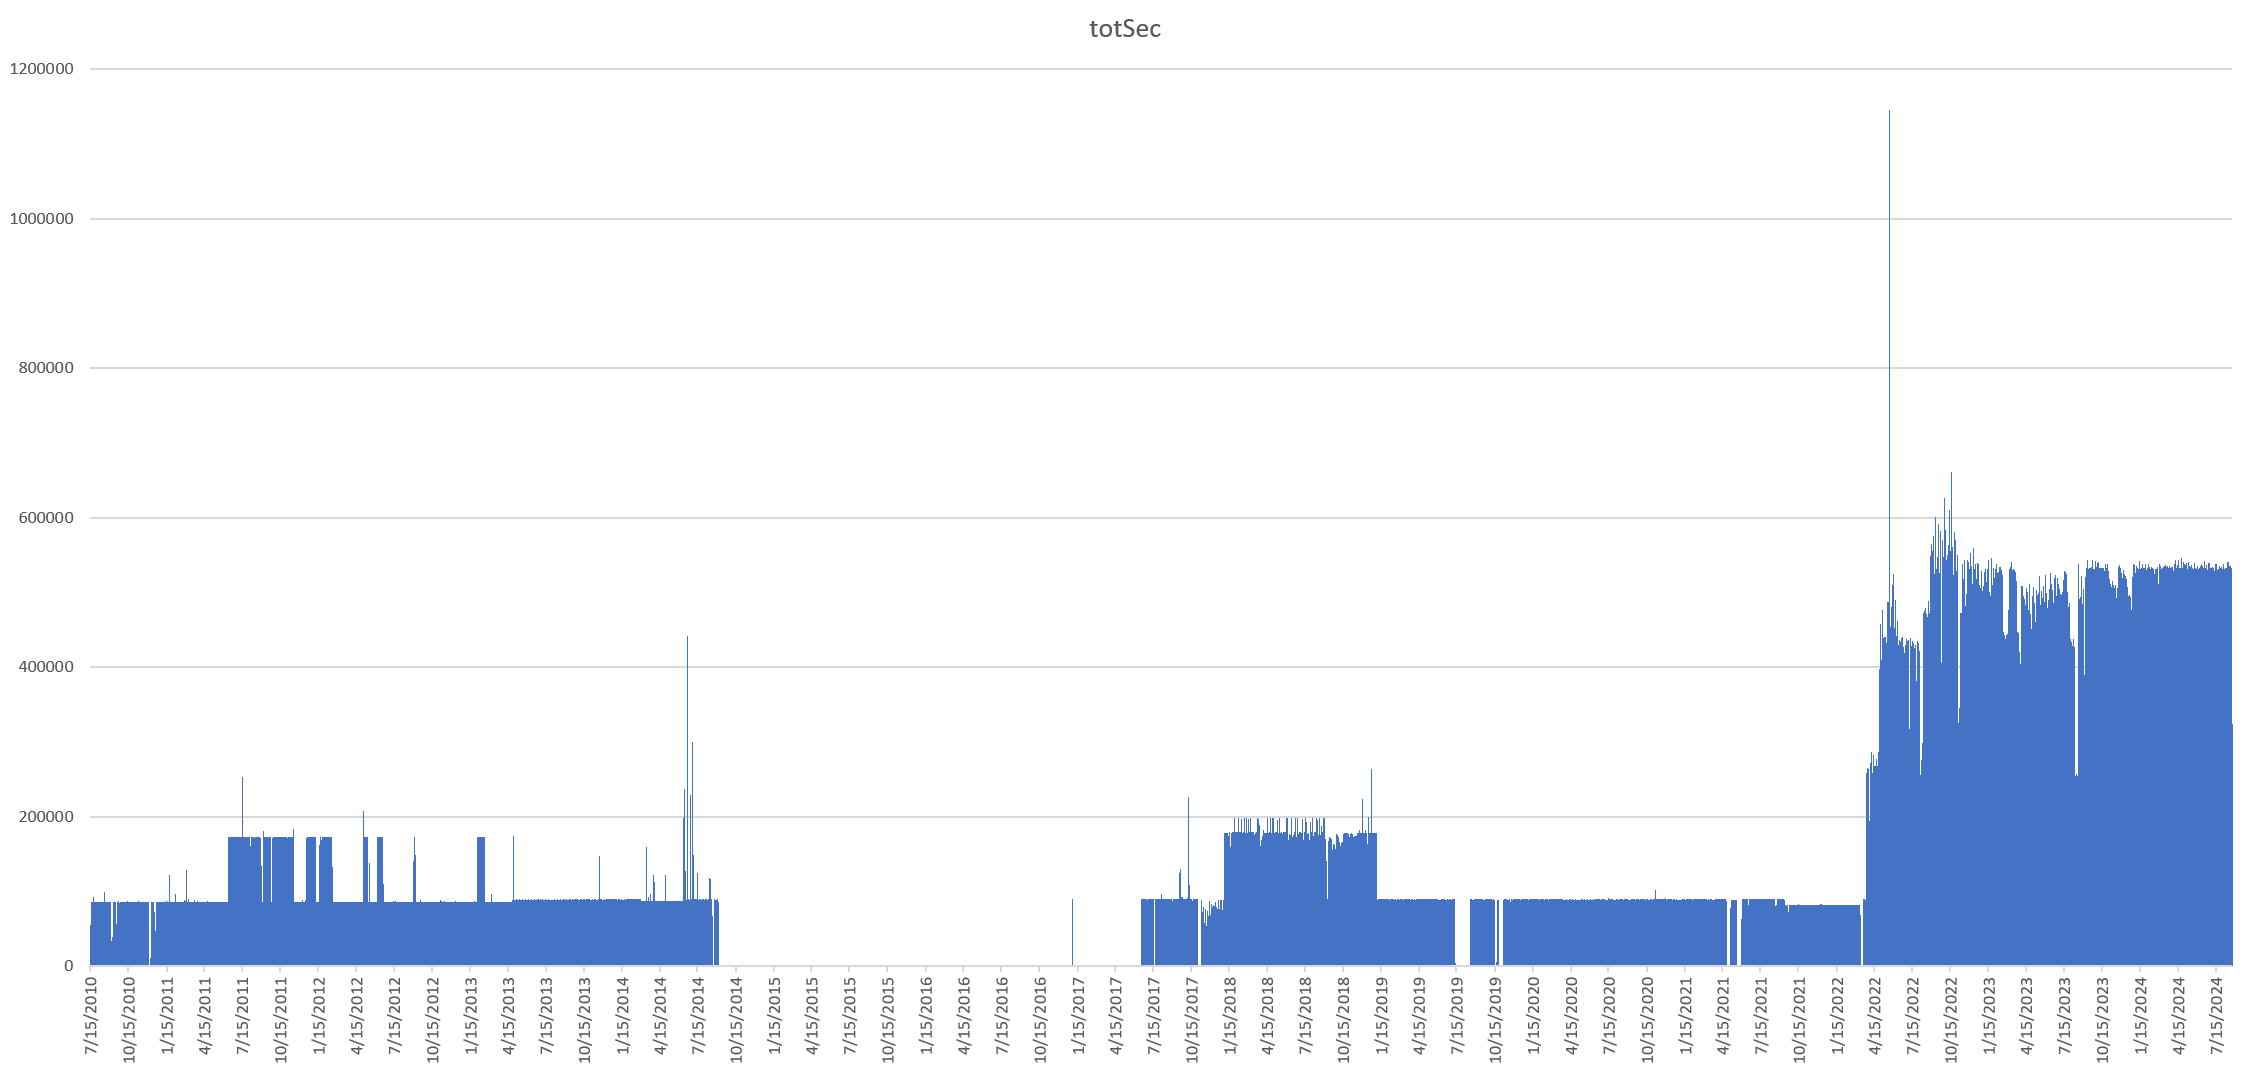
And total airtime:
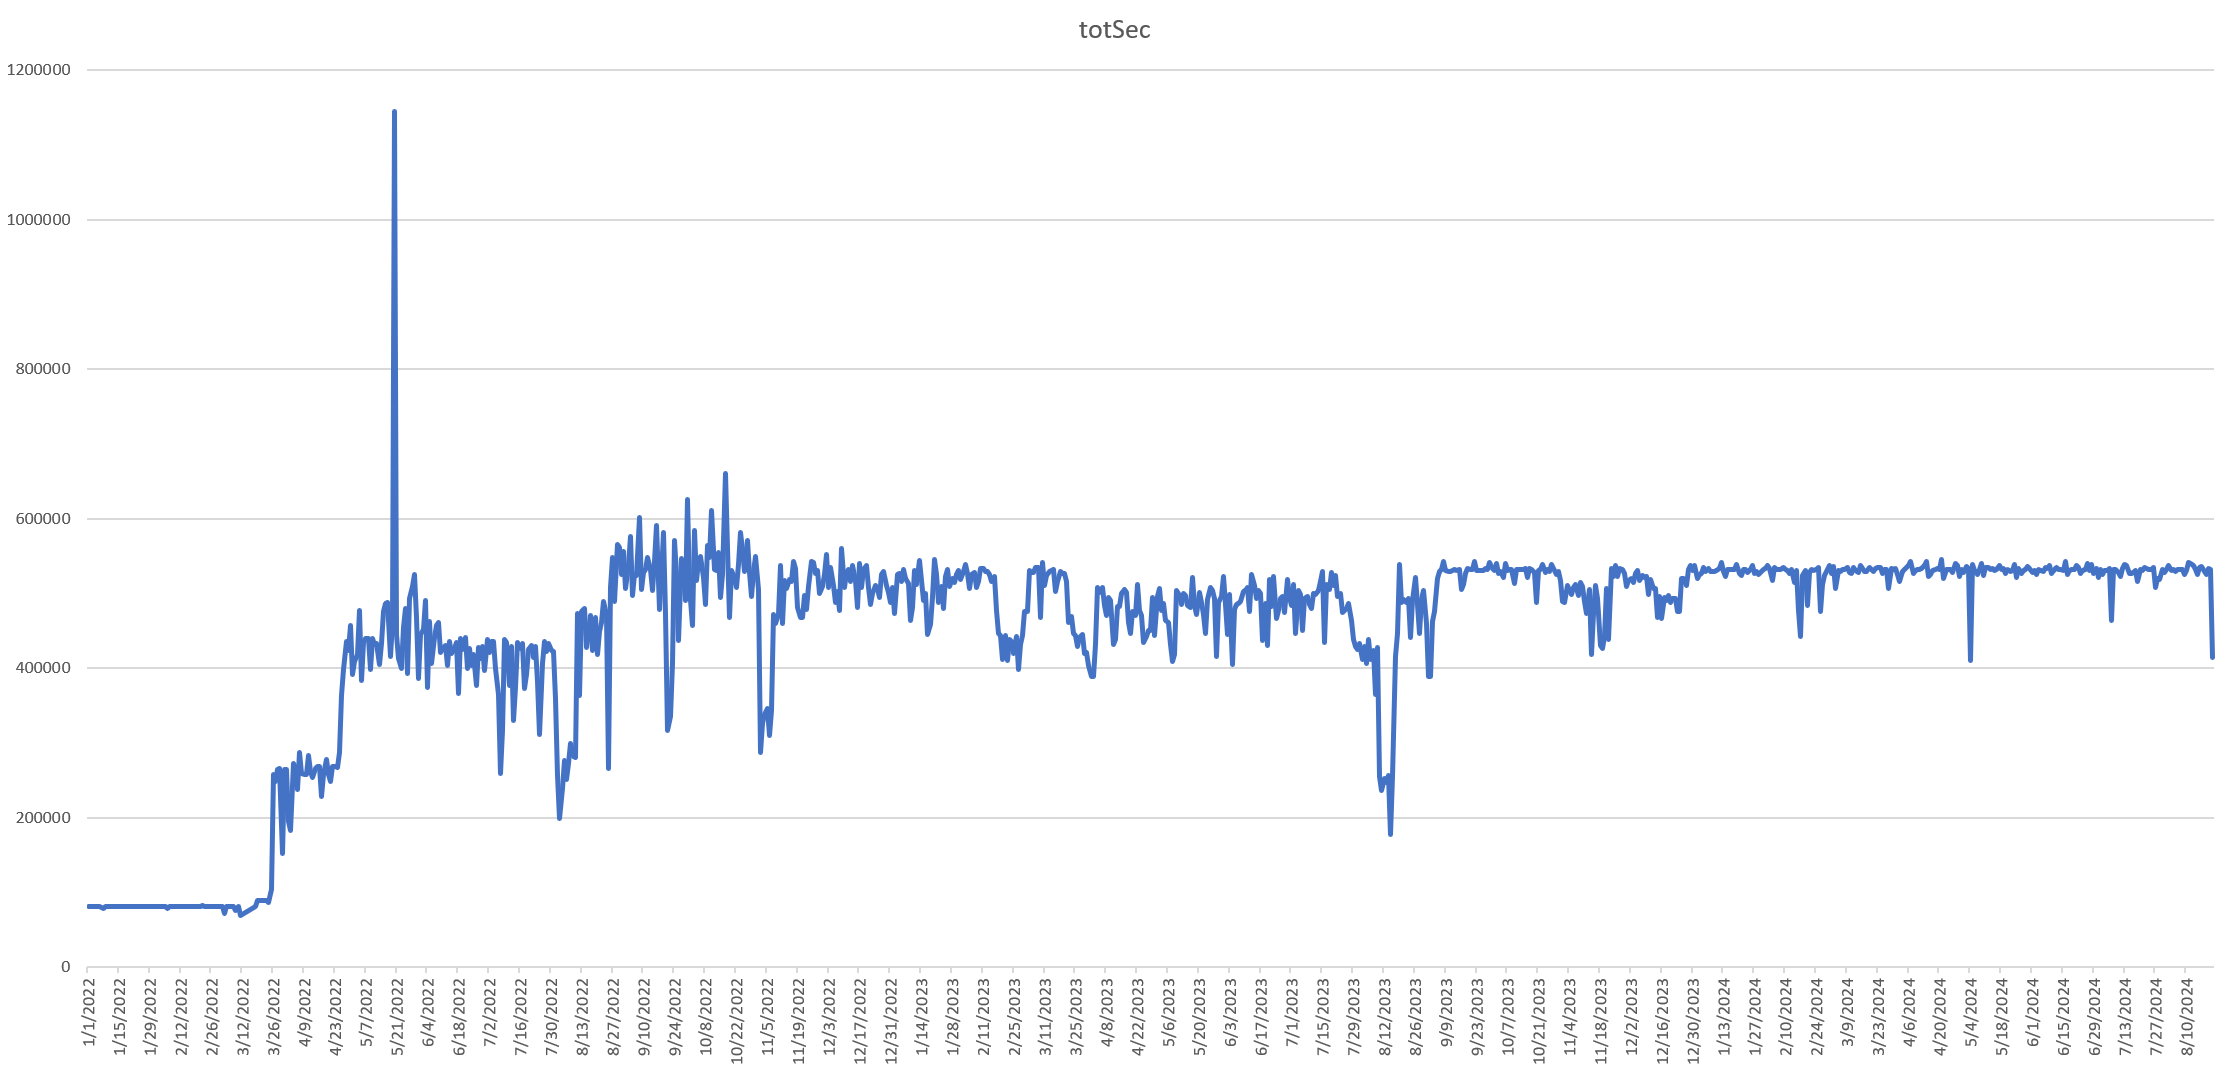
We can zoom into the 2022-present period to see the impact of the Archive's adding of the additional channels:
SELECT DATE, COUNT(1) totShows, ROUND(SUM(sec)) totSec, ROUND(SUM(bytes)) totBytes, ROUND(SUM(pixels)) totVEPixels from (
select FORMAT_DATE('%m/%d/%Y', PARSE_DATE('%Y%m%d', substr(rowkey, 0, 8) )) AS DATE,
  CAST(substr(rowkey, 0, 8) as NUMERIC) DATESQL,
  CAST(JSON_EXTRACT_SCALAR(DOWN, '$.durSec') AS FLOAT64) sec,
  CAST(JSON_EXTRACT_SCALAR(DOWN, '$.sizeBytes') AS FLOAT64) bytes,
 (
    (CAST(JSON_EXTRACT_SCALAR(DOWN, '$.durSec') AS FLOAT64) / 4) *
    CAST(JSON_EXTRACT_SCALAR(DOWN, '$.height') AS FLOAT64) *
    CAST(JSON_EXTRACT_SCALAR(DOWN, '$.width') AS FLOAT64)
  ) AS pixels FROM (
  SELECT
  rowkey, ( select array(select value from unnest(cell))[OFFSET(0)]  from unnest(cf.column) where name in ('DOWN') ) DOWN
  FROM `[PROJECTID].bigtableconnections.digtwin`
 ) WHERE DOWN like '%DOWNLOADED_SUCCESS%' and CAST(substr(rowkey, 0, 8) as NUMERIC) > 20220000 and JSON_EXTRACT_SCALAR(DOWN, '$.chan') in ('1TV',' NTV', 'RUSSIA1', 'RUSSIA24', 'RT', 'ESPRESO', 'BELARUSTV')
) group by date order by DATE
Yielding: