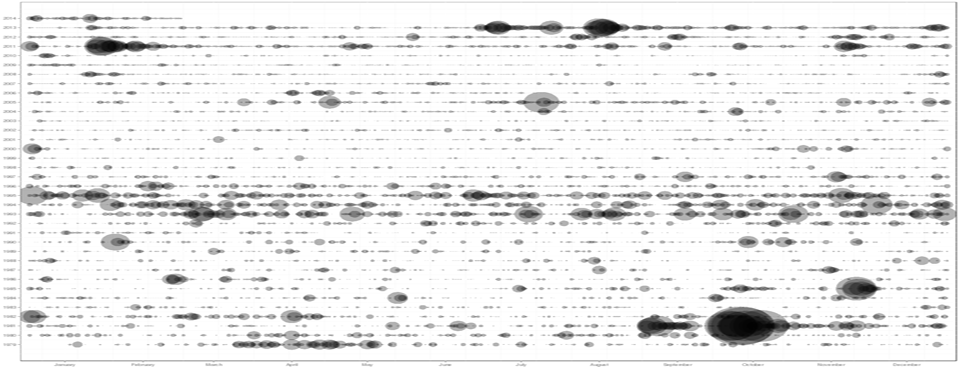
The concept of time is at once one of the most basic dimensions through which to understand and visualize conflict, yet simultaneously it is one of the more difficult to represent concisely at high resolution. Representing daily change over 35 years requires arraying more than 12,700 data points in a single one-dimensional linear display. Traditionally time series datasets are aggregated to the weekly, monthly, or yearly levels, but this masks short bursts of activity, such as an isolated attack or brief military incursion in favor of larger trends of unrest.
Further, anniversary unrest, which is critically important to understanding conflict in certain areas of the world, occurs on a regular, often annual basis, on the anniversary of a specific historical occurrence. Such temporal recurrence is exceptionally difficult to detect from such visualizations, as they array time in a single dimension.
To address this, the new GDELT Timeline Visualizer offers a unique two-dimensional gridded timeline that displays years along the Y axis and all 365 days of each year along the X axis from January 1 to December 31. At each grid cell, a semi-transparent dot is displayed, sized based on the intensity of matching events on that date. This allows the display of daily-level data over multiple decades to be represented in a single compact visualization. Moreover, temporal cycles, such as anniversary unrest, are immediately visible, as are the regularity of gaps between periods of unrest.
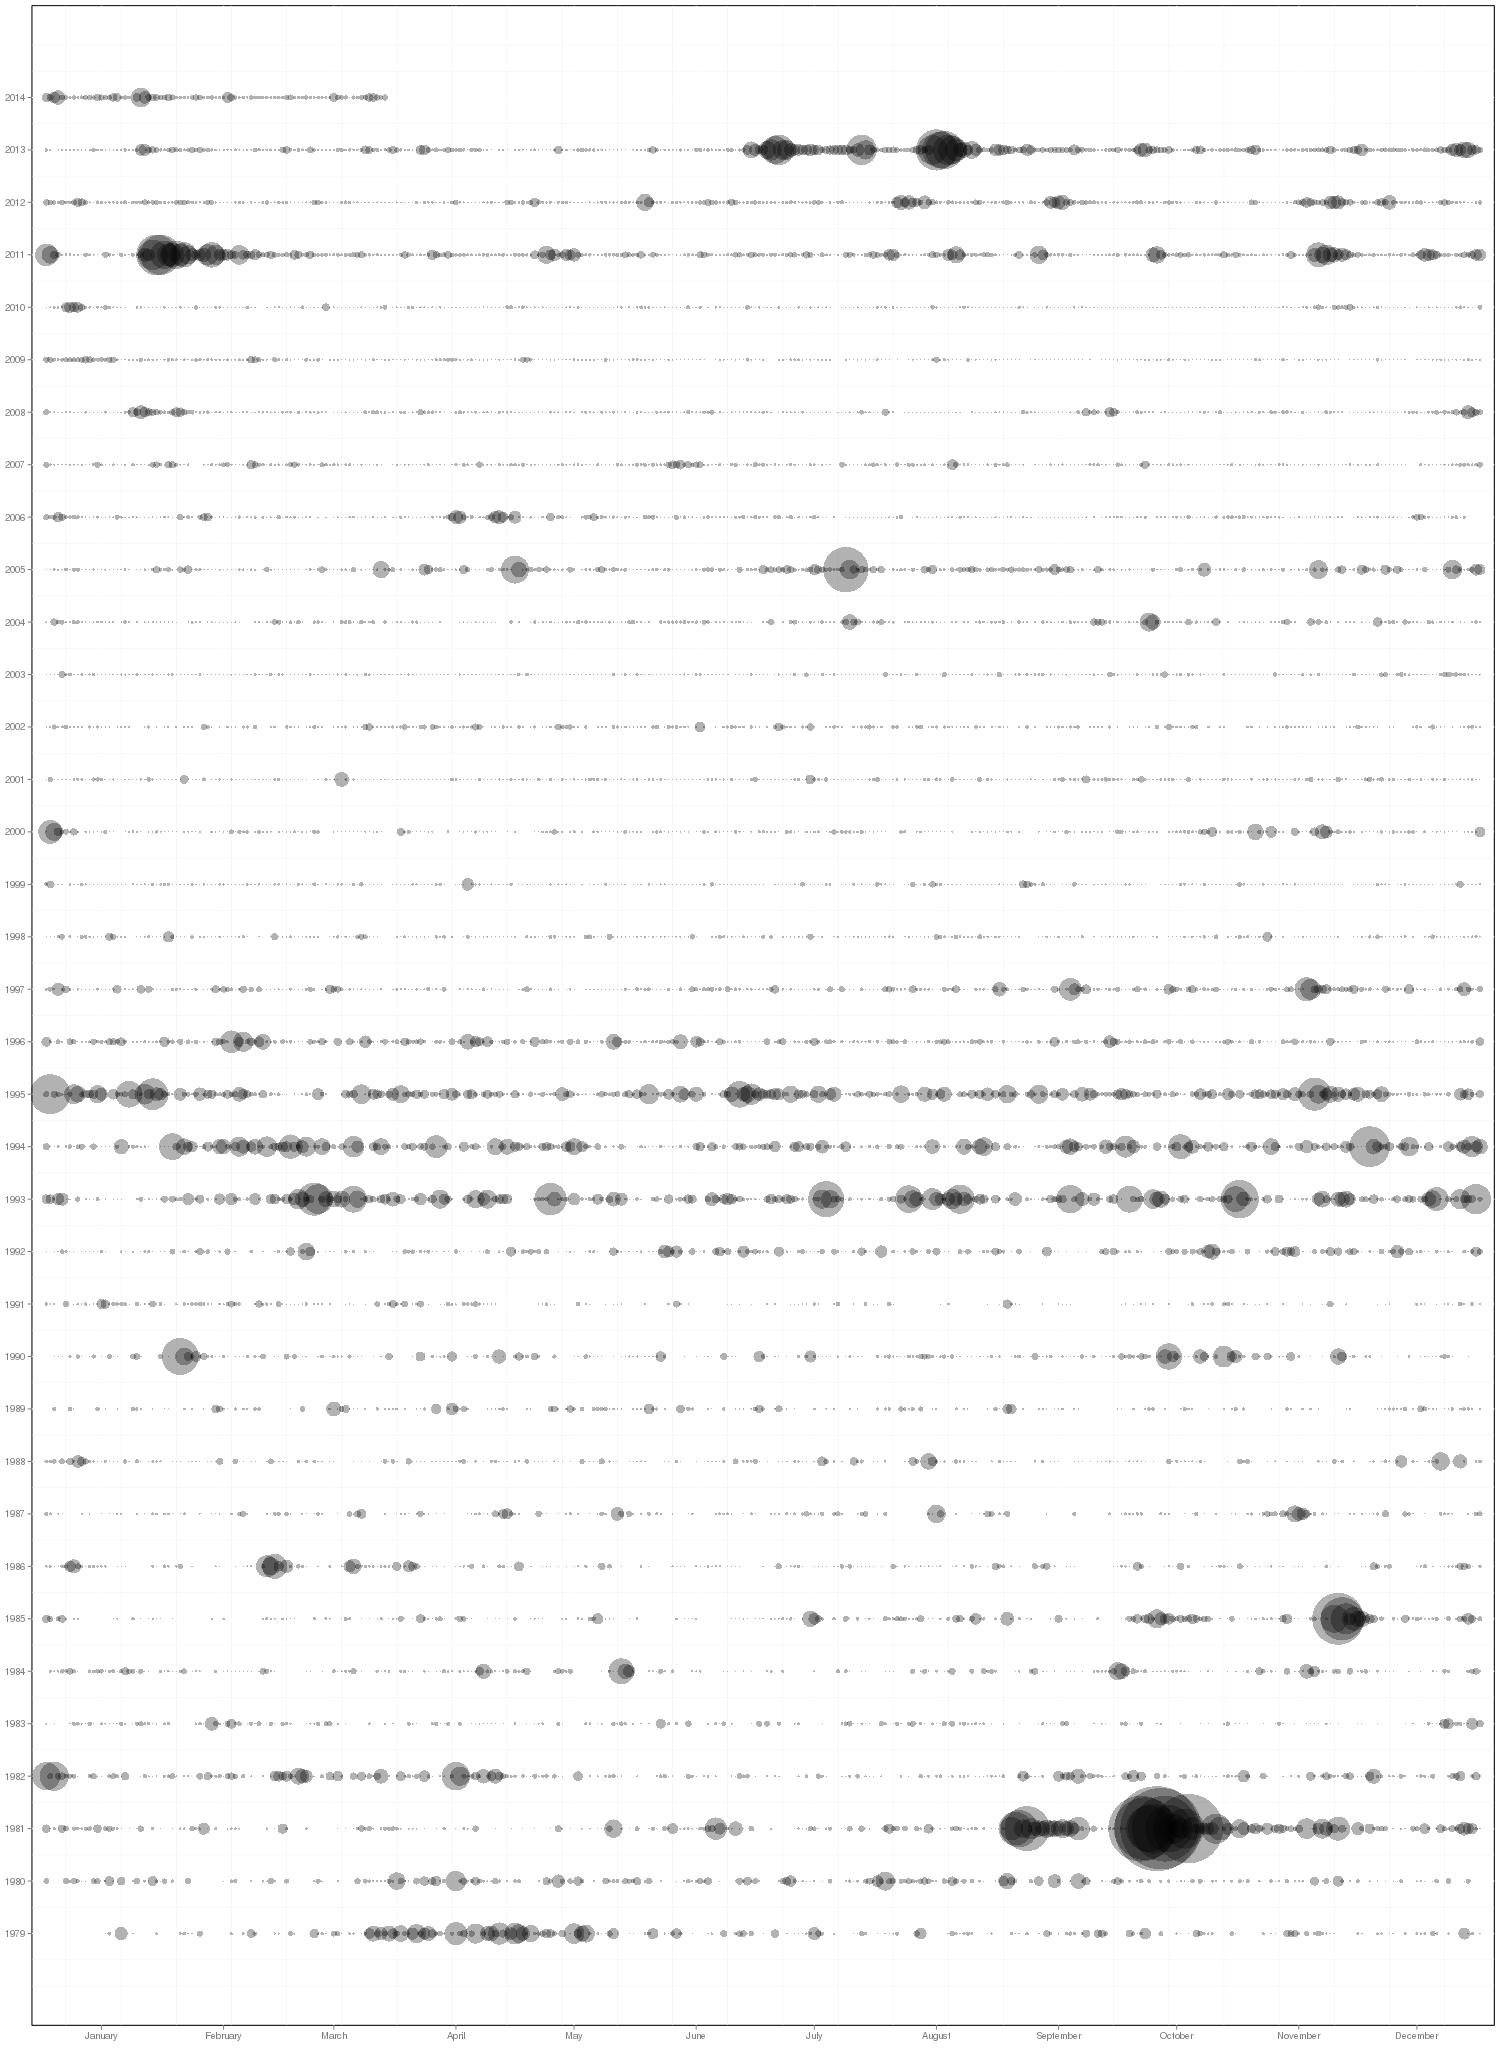
The timeline above shows all Material Conflict events occurring in Egypt from January 1, 1979 to March 28, 2014. Immediately clear from this timeline is that the level of reported unrest in the country during the October 1981 assassination of President Anwar Sadat was considerably larger than during the January 2011 revolution or the 2013 unrest. The sustained unrest of 1993-1995 is also clearly visible, as are many other bursts of unrest.
Try it for yourself with the Event Timeline Visualization or the Global Knowledge Graph Timeline Visualization from the GDELT Analysis Service!
Happy timelining!