Perhaps the most famous visualizations from Culturomics 2.0 were the geographic networks that illustrated how the geography of the world is interconnected through the eyes of the news media. Geographically-situated networks, in which nodes are placed in space at their actual geographic locations, offer an incredibly rich new analytic framework that blends spatial and non-spatial connectivity in a single visual. To support this new kind of visualization, Event and Global Knowledge Graph Geographic Network visualization tools allow you to create your own spatial network displays to explore how the world’s geography is connected.
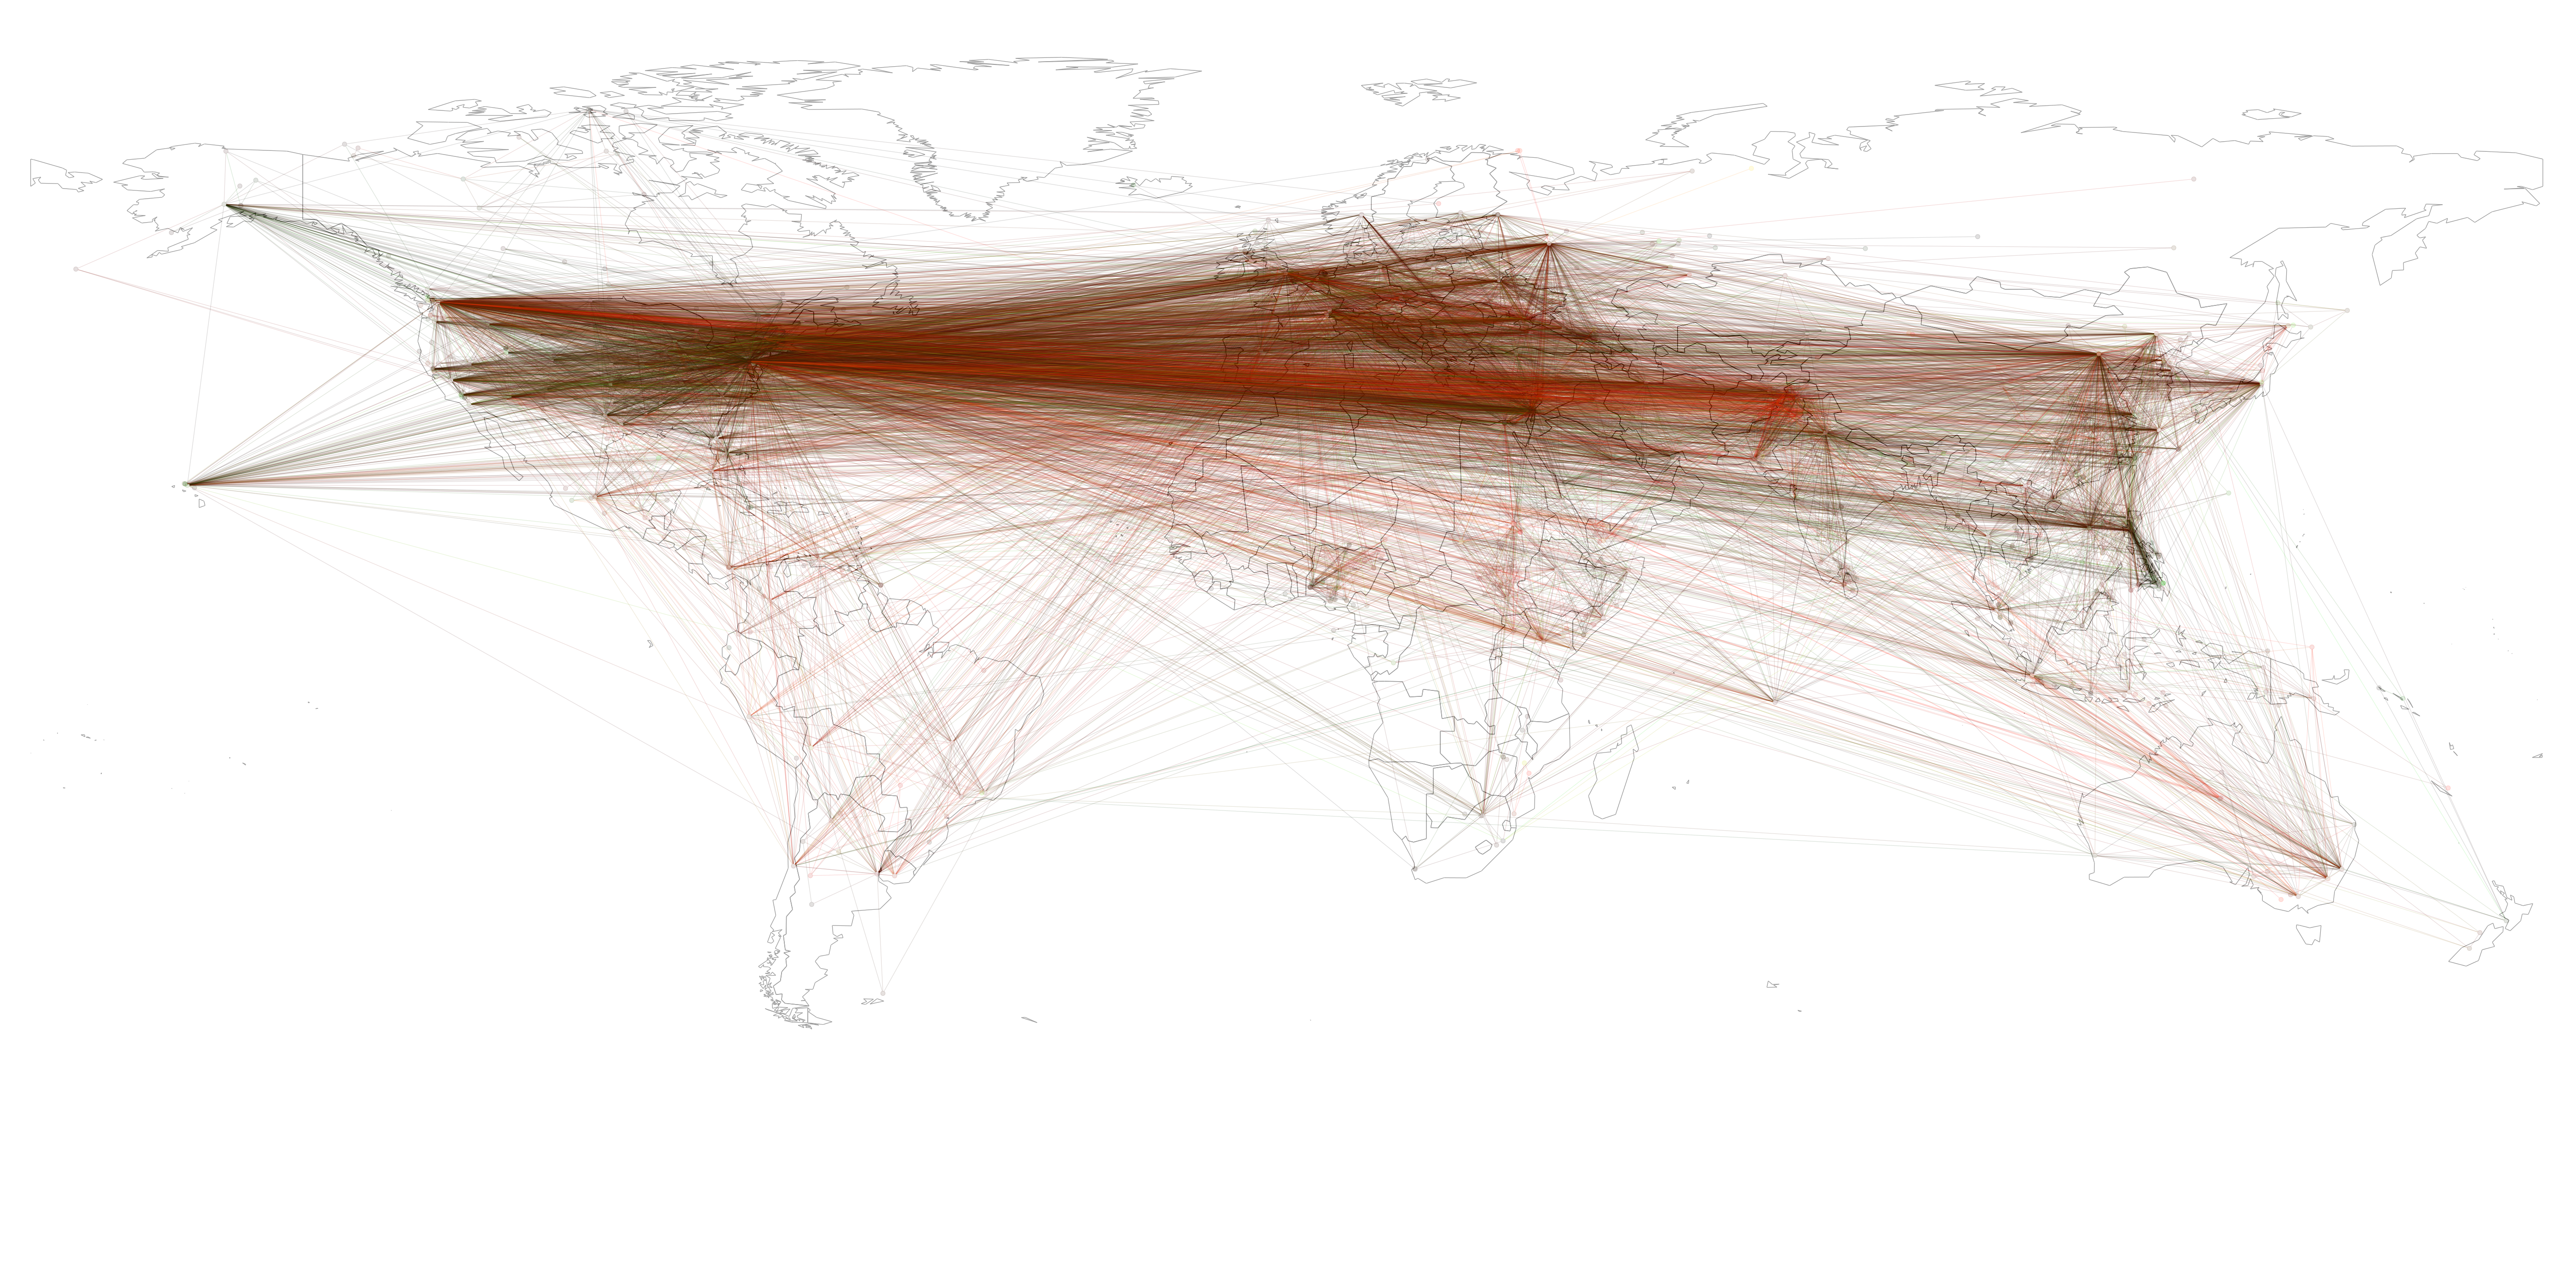
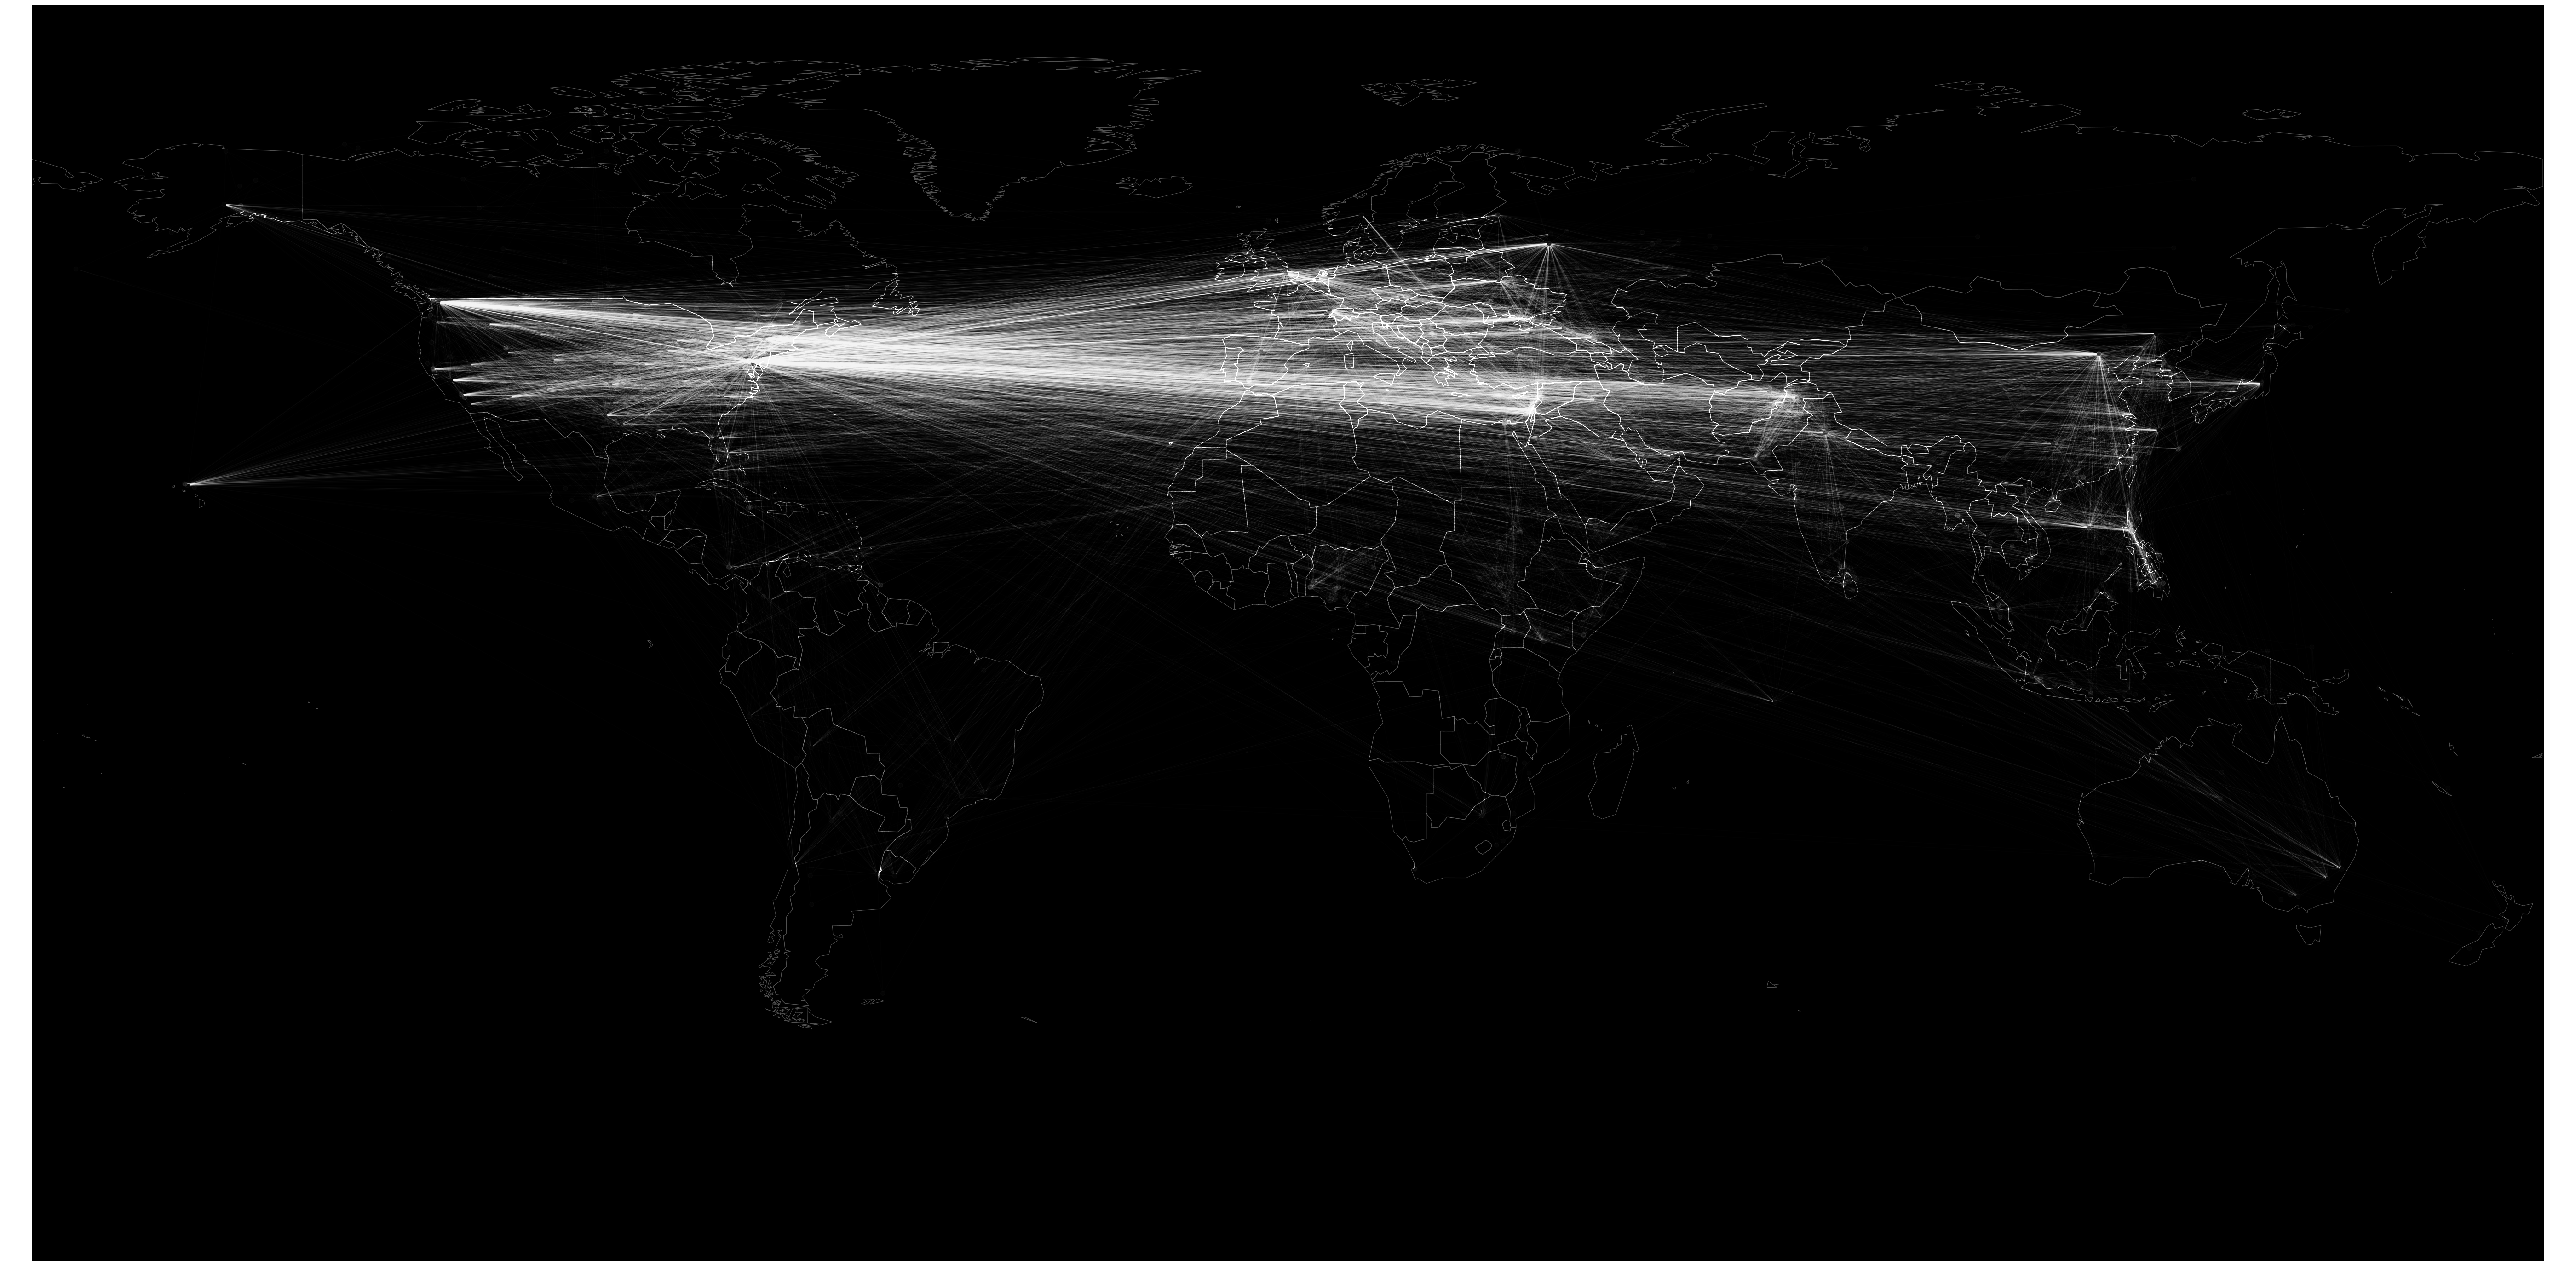
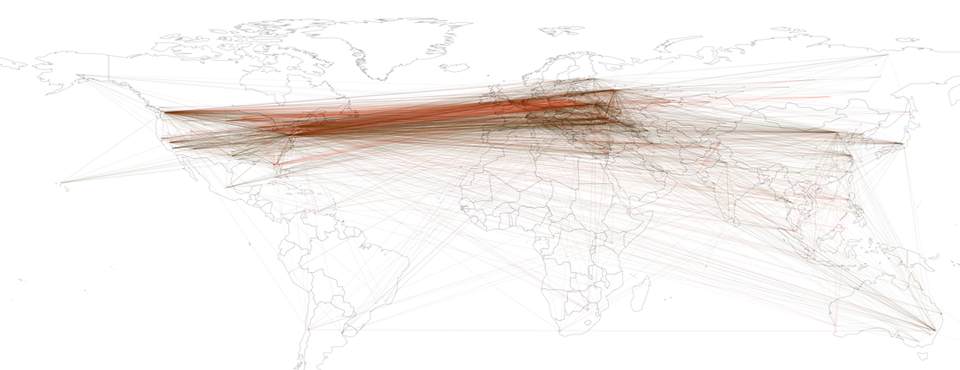
The two images above demonstrate the results of applying the Geographic Network visualization to the Global Knowledge Graph Theme “SOVEREIGNTY”. Here every location worldwide that was mentioned alongside of sovereignty April 1, 2013 to March 29, 2014 is illustrated by a dot on the map, and lines are drawn between every pair of locations discussed alongside one another in the context of sovereignty. The first map color-codes each line by the average “tone” of all discussion connecting the two locations, from bright red (high negativity) to bright green (high positivity). While this can yield fascinating conflict/cooperation insights, it can also be difficult in high-density areas to understand the micro-level connectivity due to all of the lines. Thus, the second image uses a black background and draws all lines in semi-transparent white, making interconnected regions immediately clear.
From the images above it is clear that over the past year discussions of sovereignty have centered heavily on Syria, Eastern Ukraine and Crimea, Russia, and the tribal regions of Pakistan and border regions of Afghanistan.
Try it for yourself with the Event Geographic Network and Global Knowledge Graph Geographic Network visualizations from the GDELT Analysis Service!