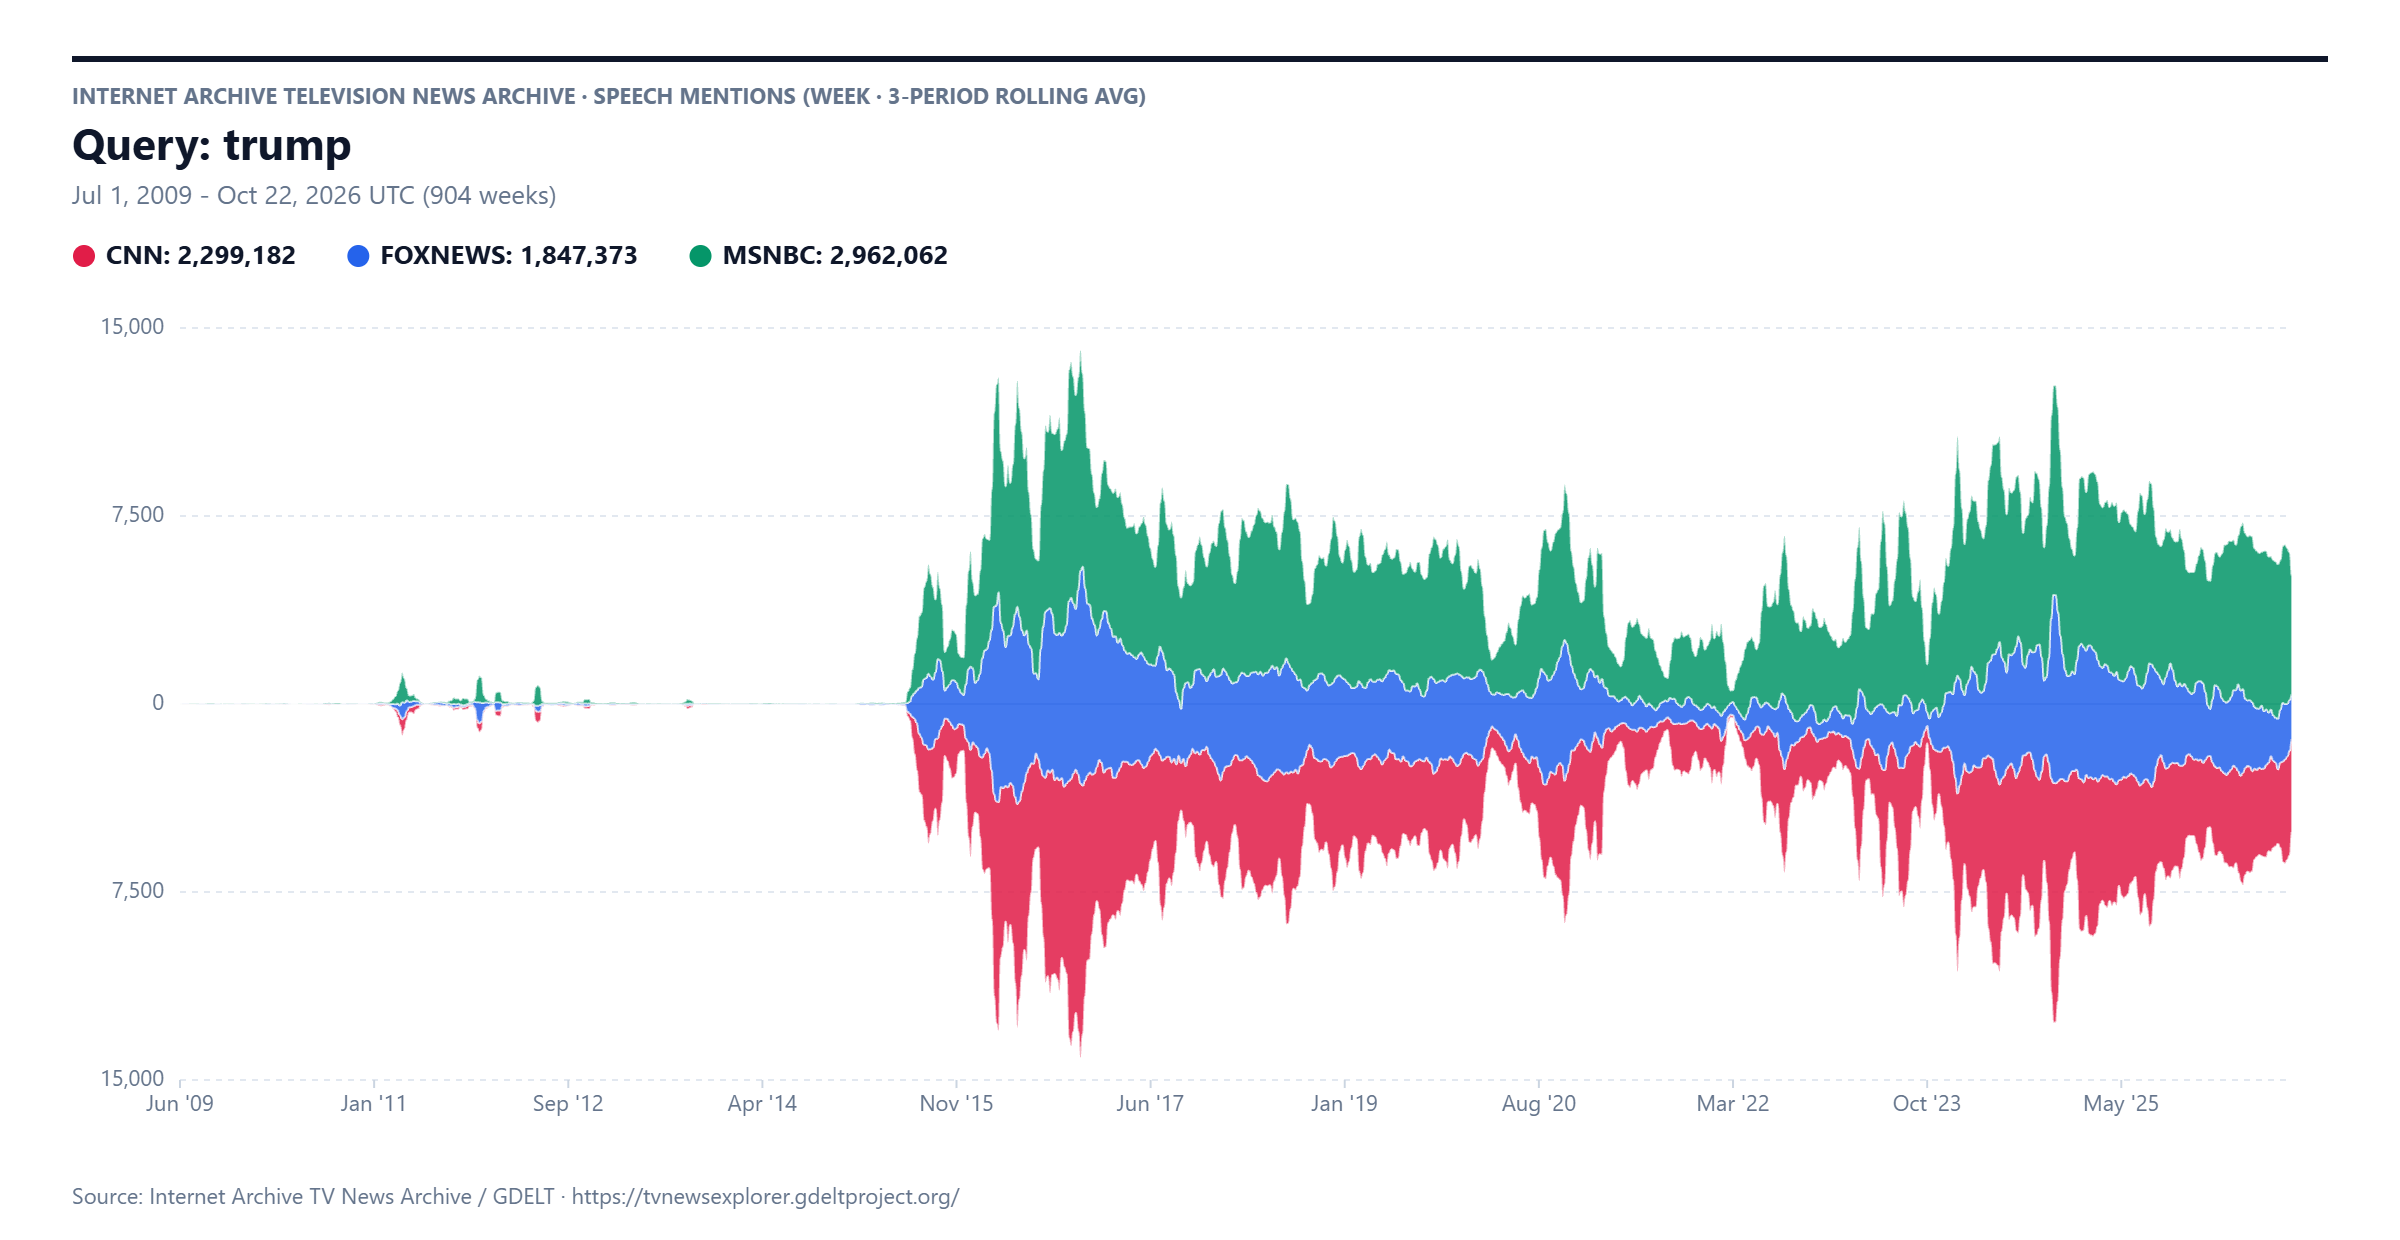
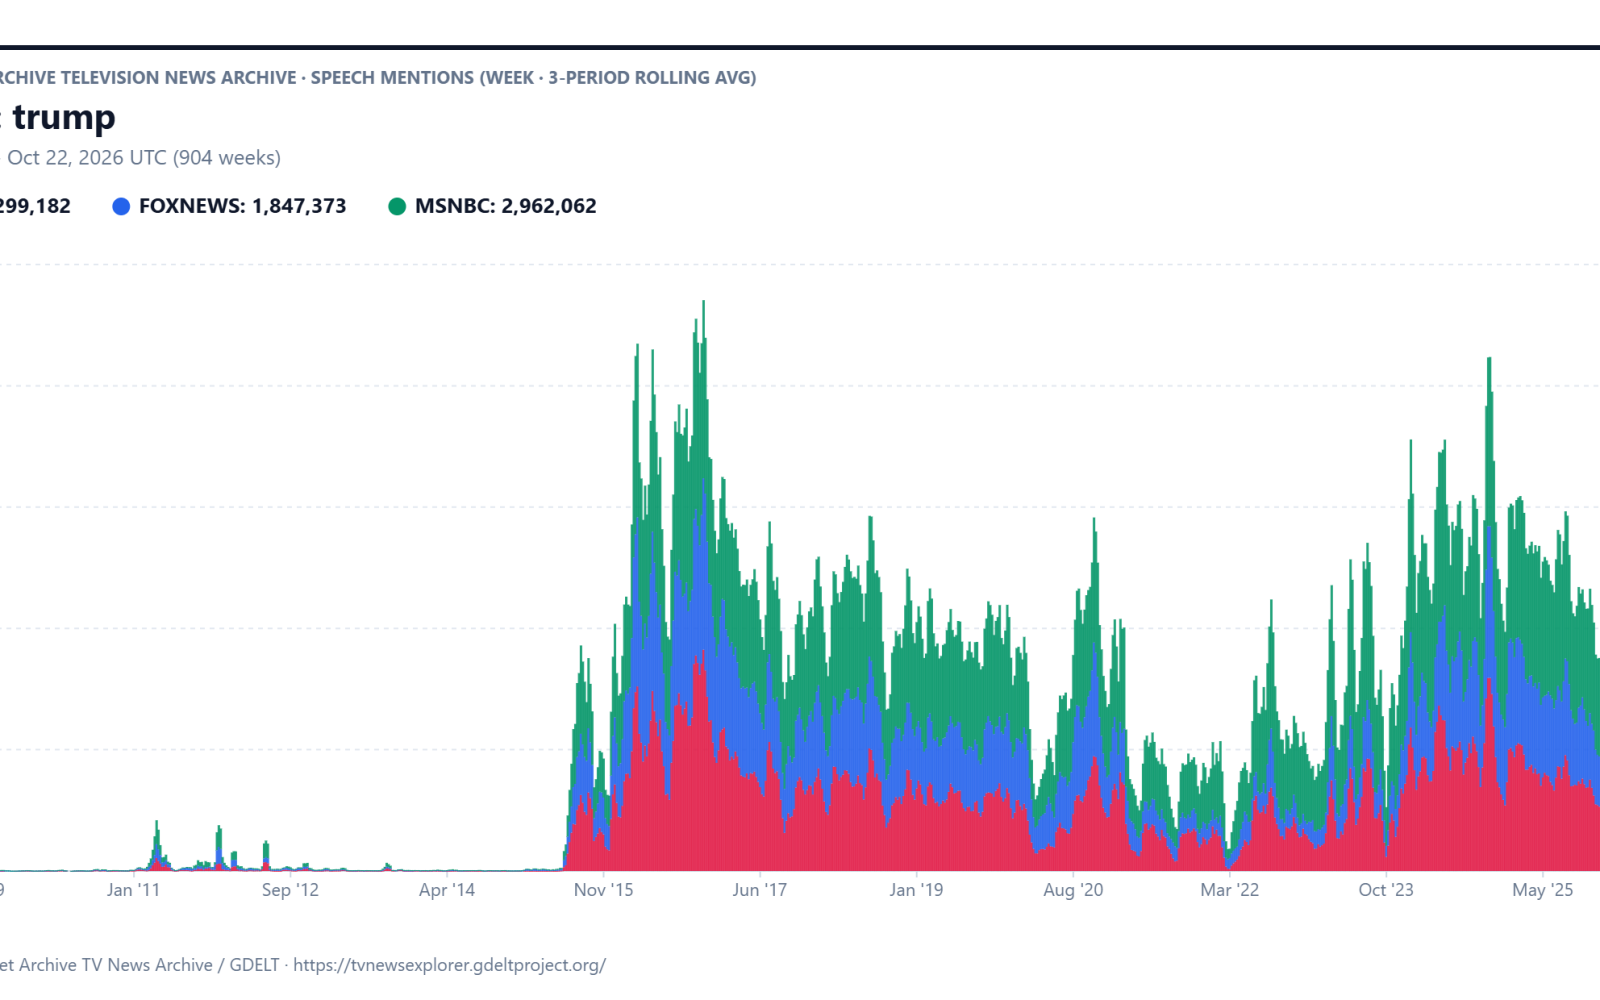
Visualizing a timeline of the total mentions of Donald Trump across CNN, MSNBC/MSNOW and Fox News over the past decade and a half is complicated by the fact that the three channels' coverage is highly correlated much of the time, meaning that when using a traditional line graph visualization, the three series overlap each other and obscure the critical periods where their coverage diverges. How might our new stacked barcharts and streamgraph displays make these divergence periods more visible to journalists and scholars?
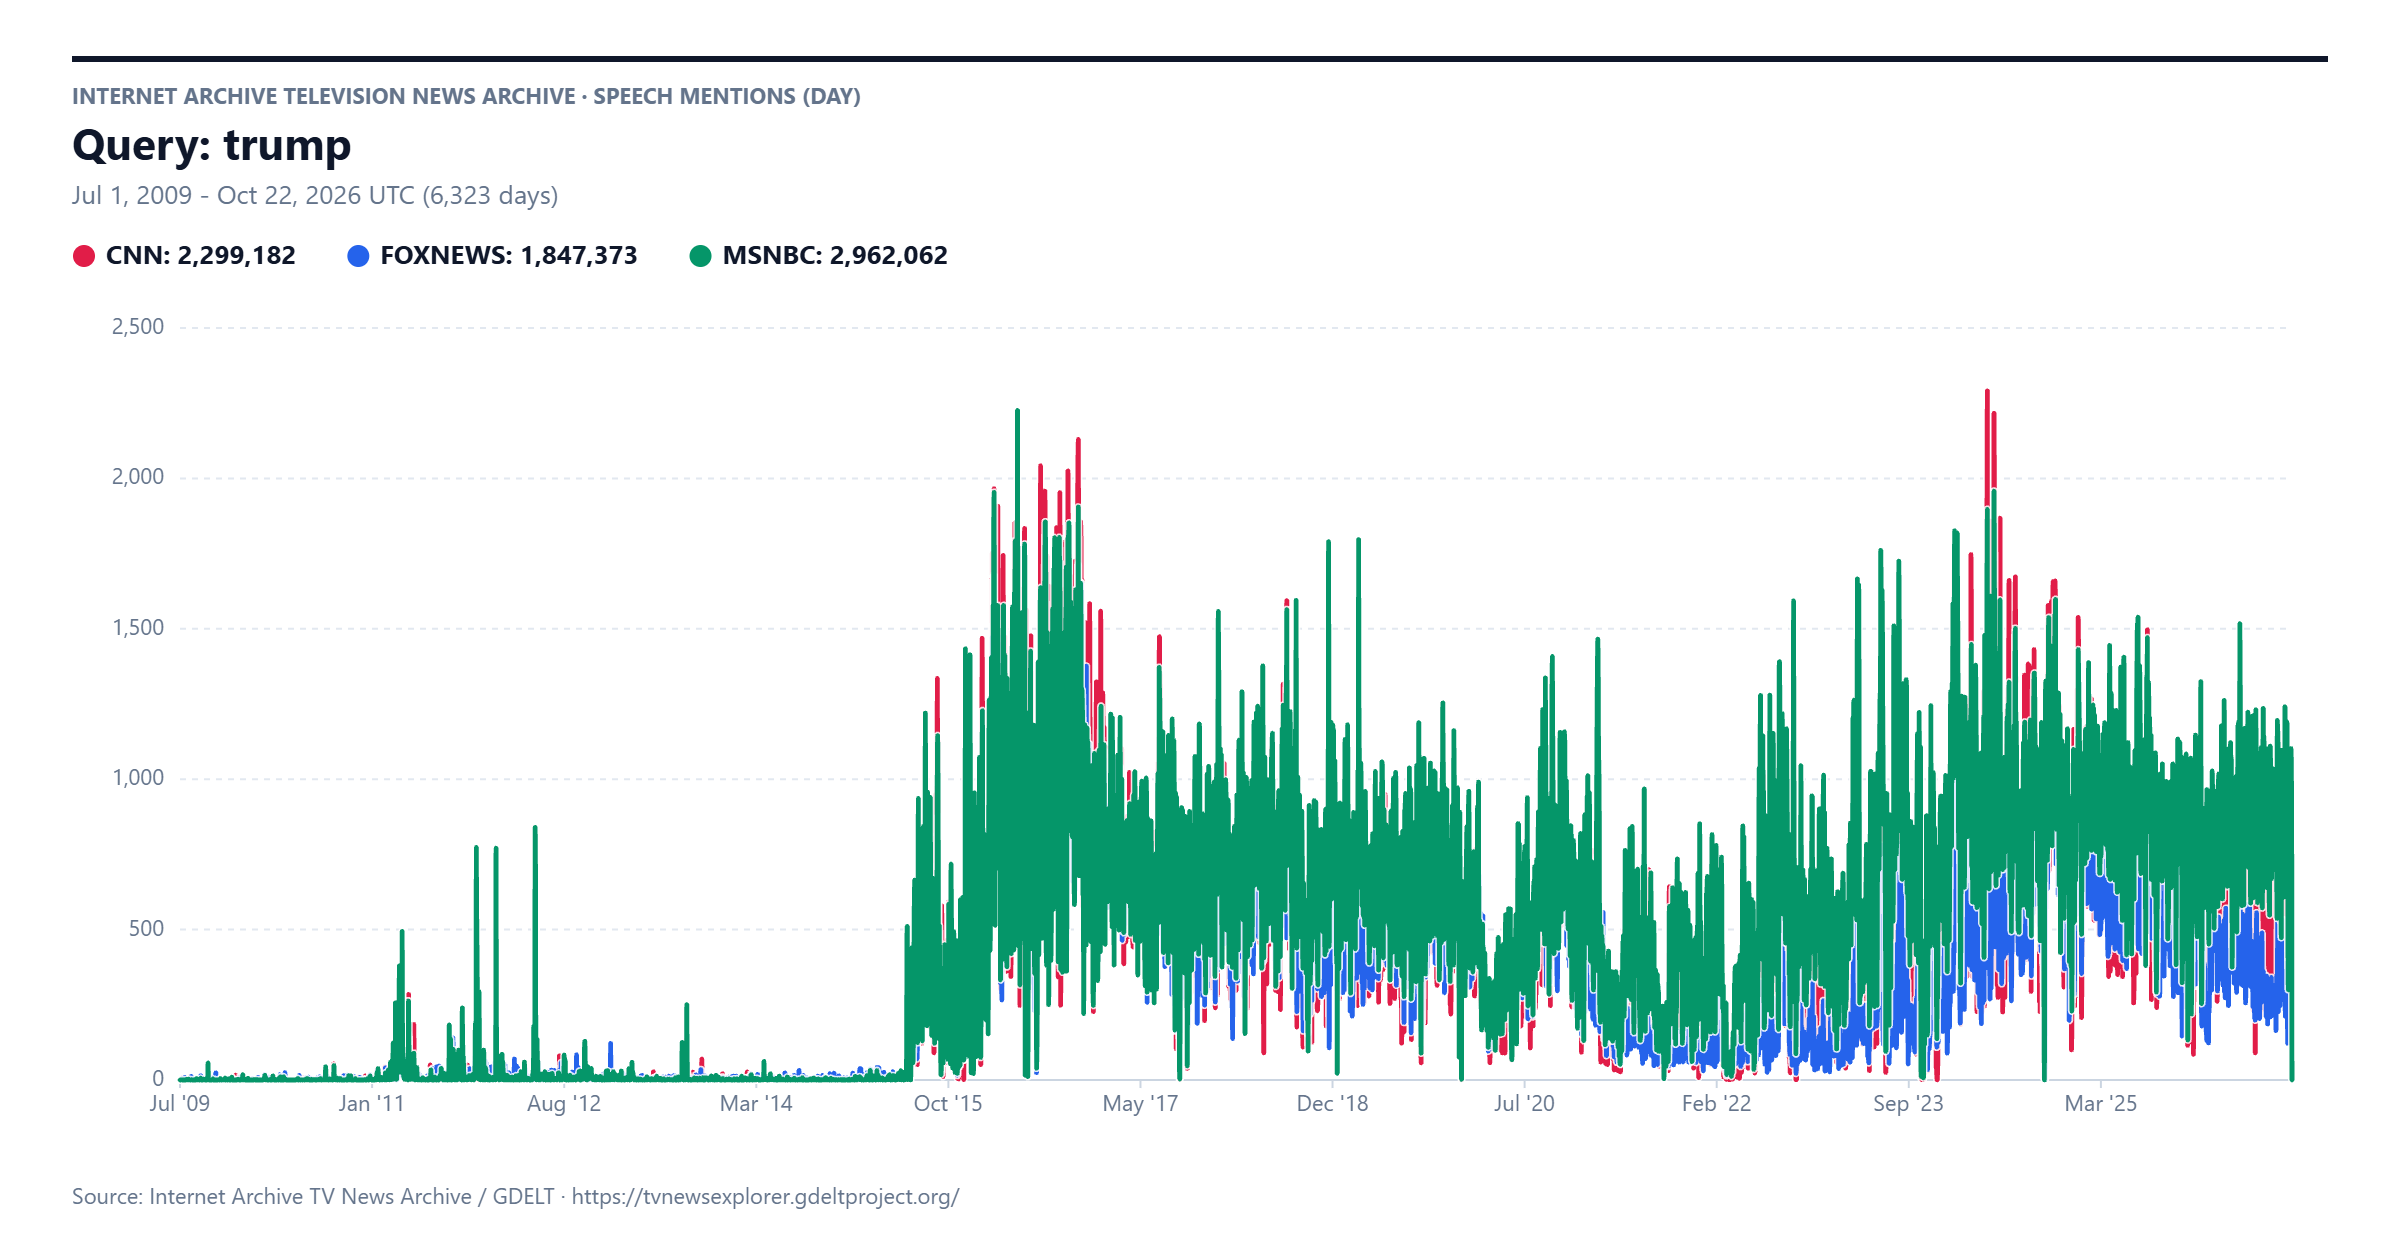
Below is a traditional line graph timeline showing the number of daily mentions of Trump across CNN, MSNBC/MSNOW and Fox News over the past decade and a half. Unfortunately, since the three timelines are highly similar for much of the timespan, they overlap so strongly that it is difficult to discern their individual differences:
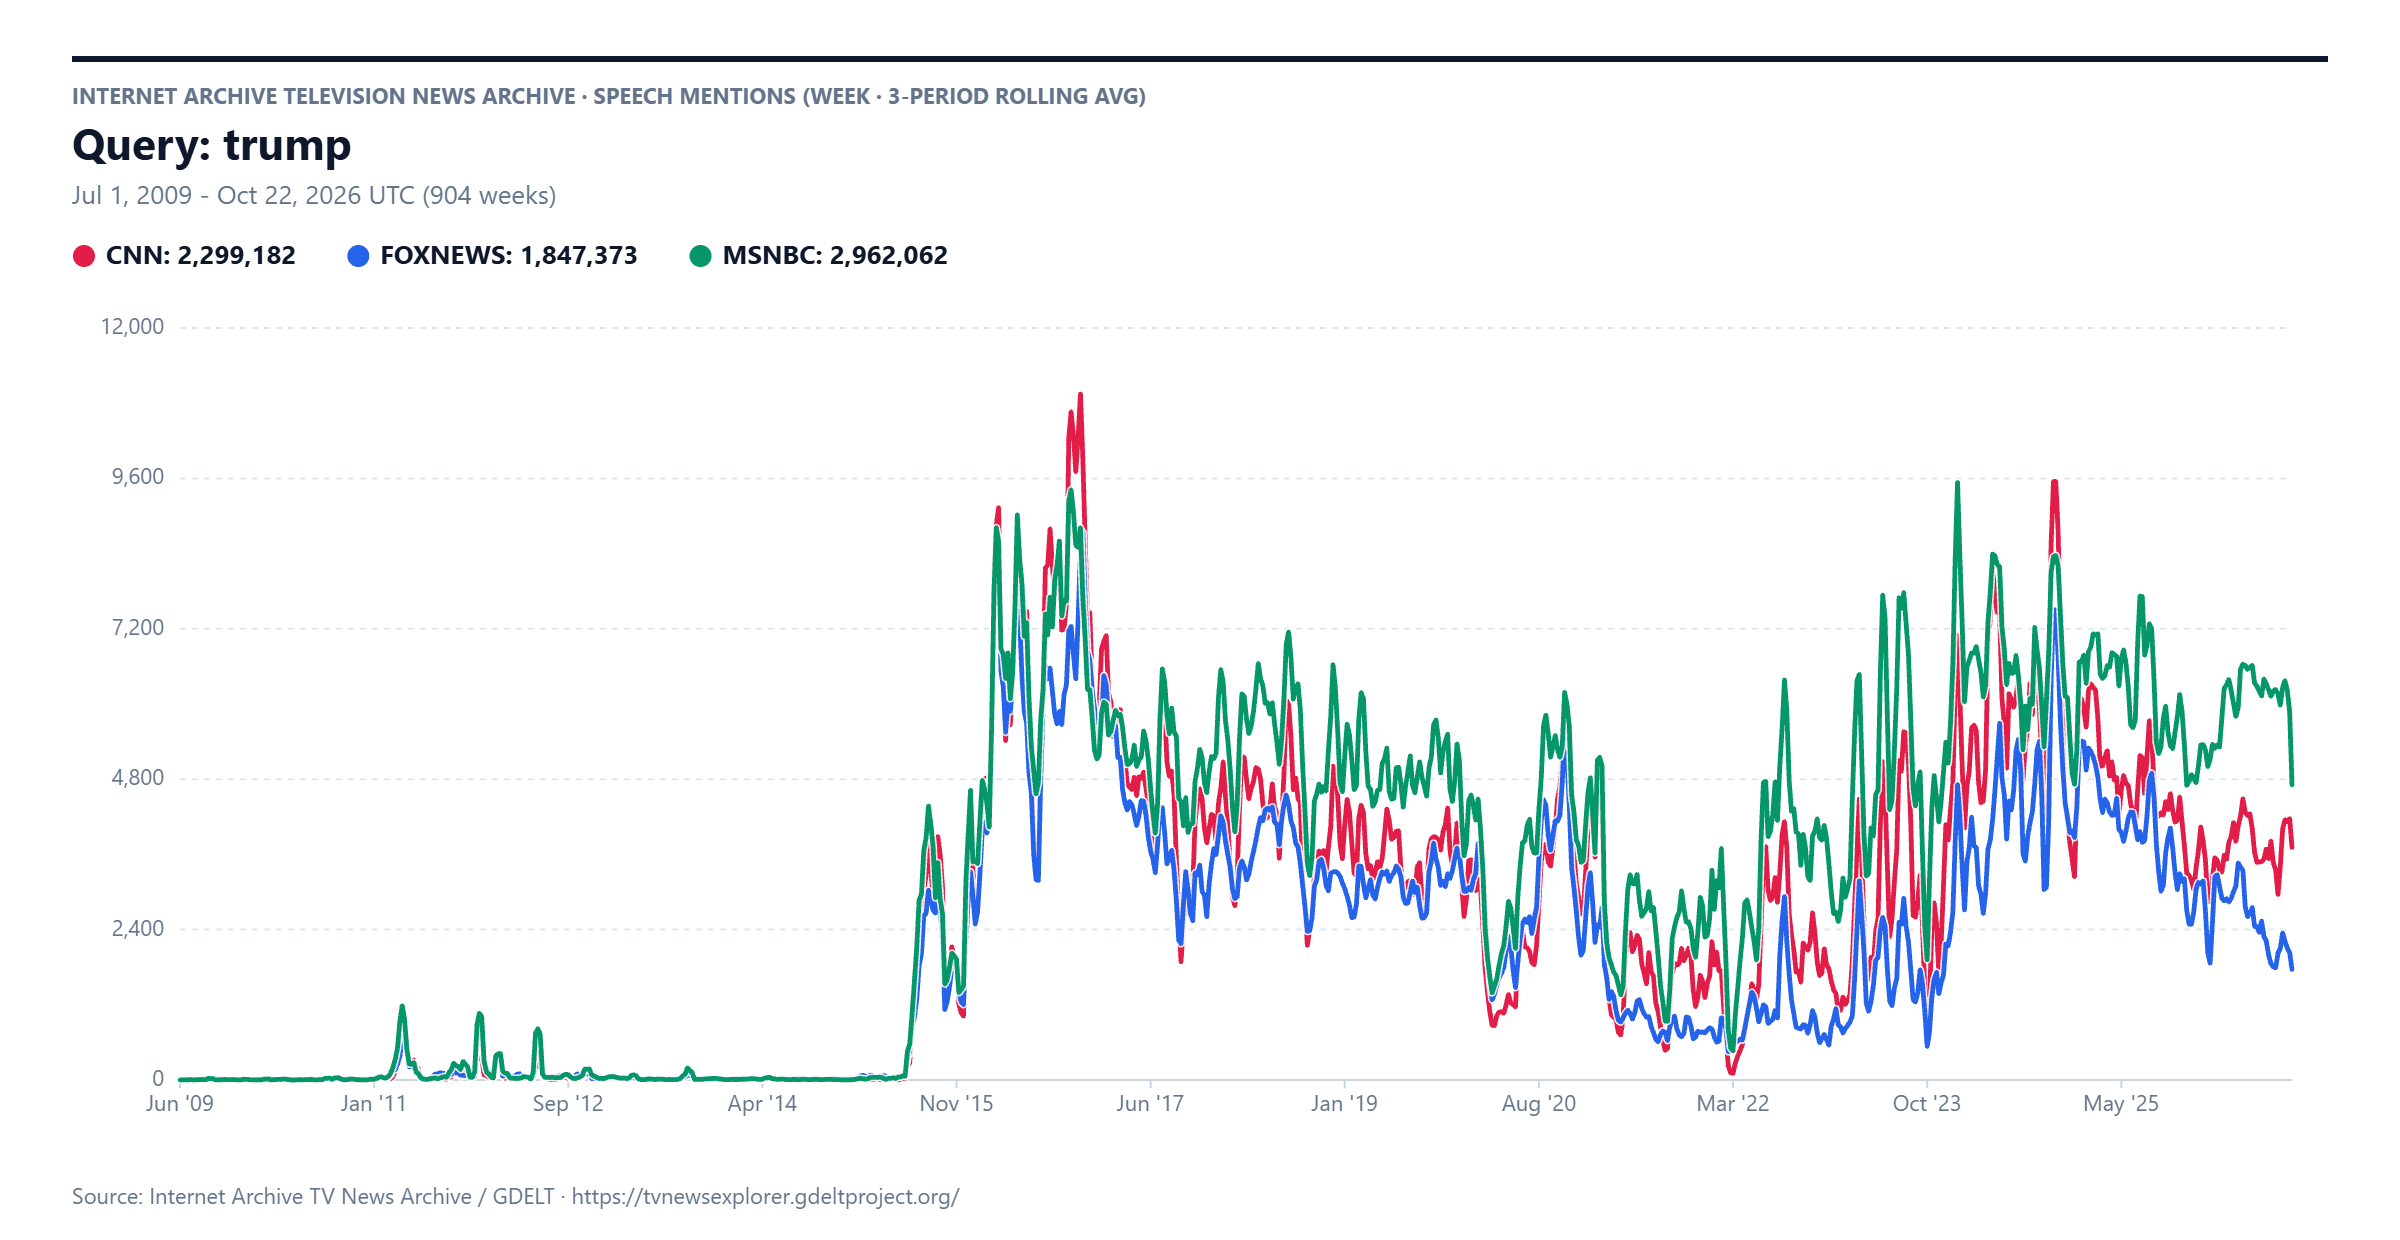
Thus, traditionally, we've visualized these timelines using weekly resolution rather than daily and using a 3-week rolling average to smooth the results, allowing us to see here the fracturing point in February 2025 when MSNBC/MSNOW continued to cover Trump at their existing levels, while CNN and Fox News steadily decreased their mentions of him:
Sometimes monthly resolution using a 3-month rolling average yields even clearer results:
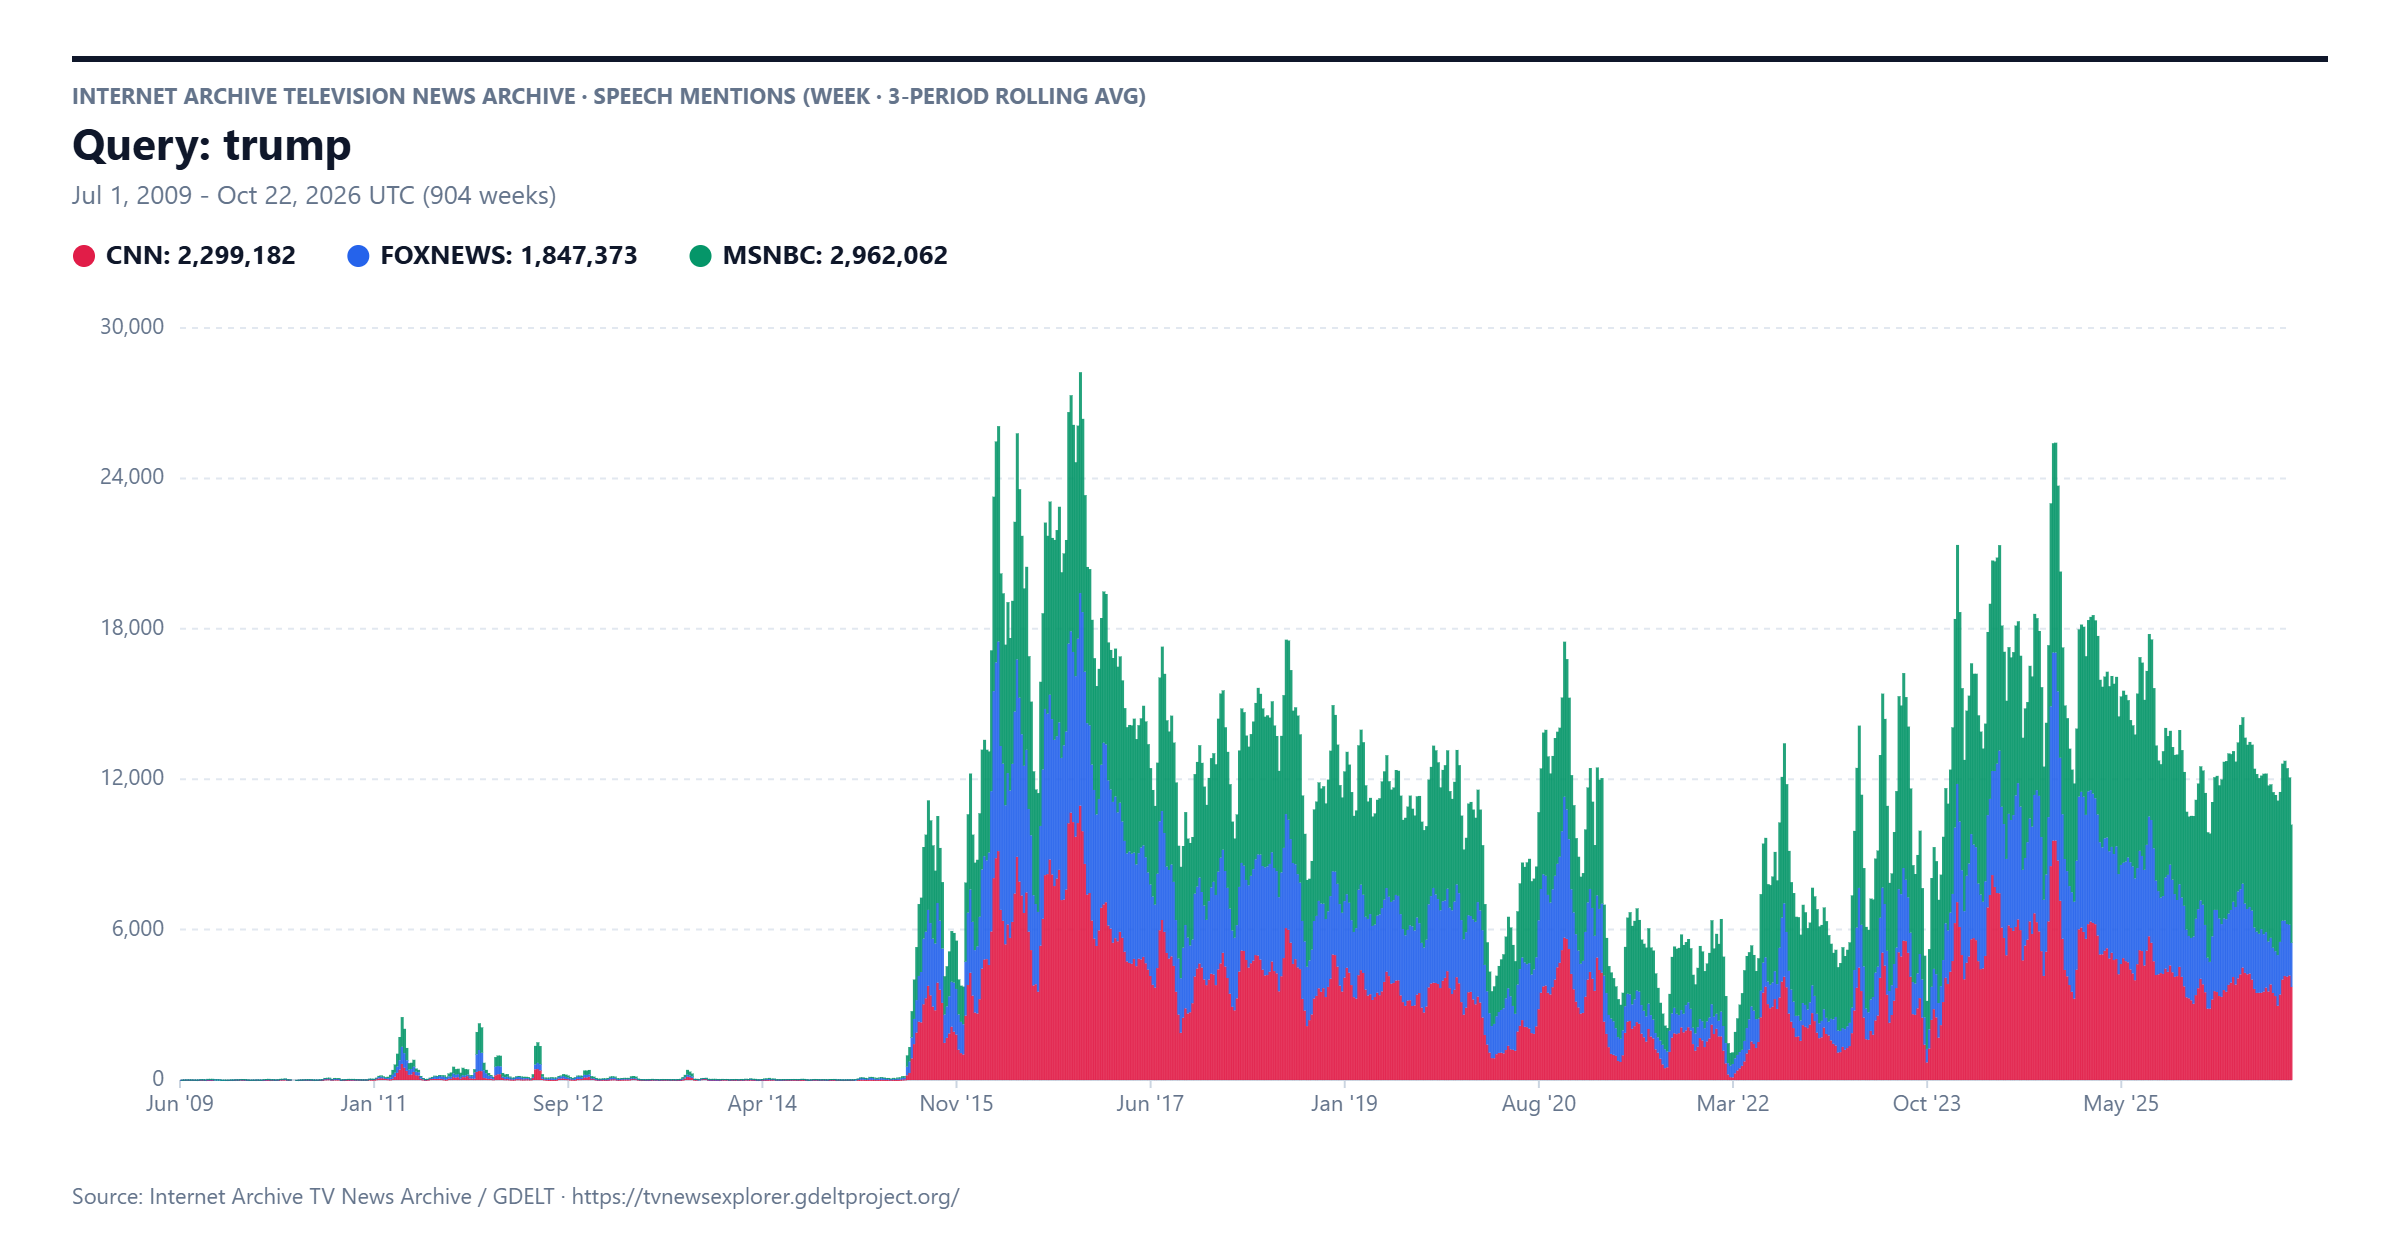
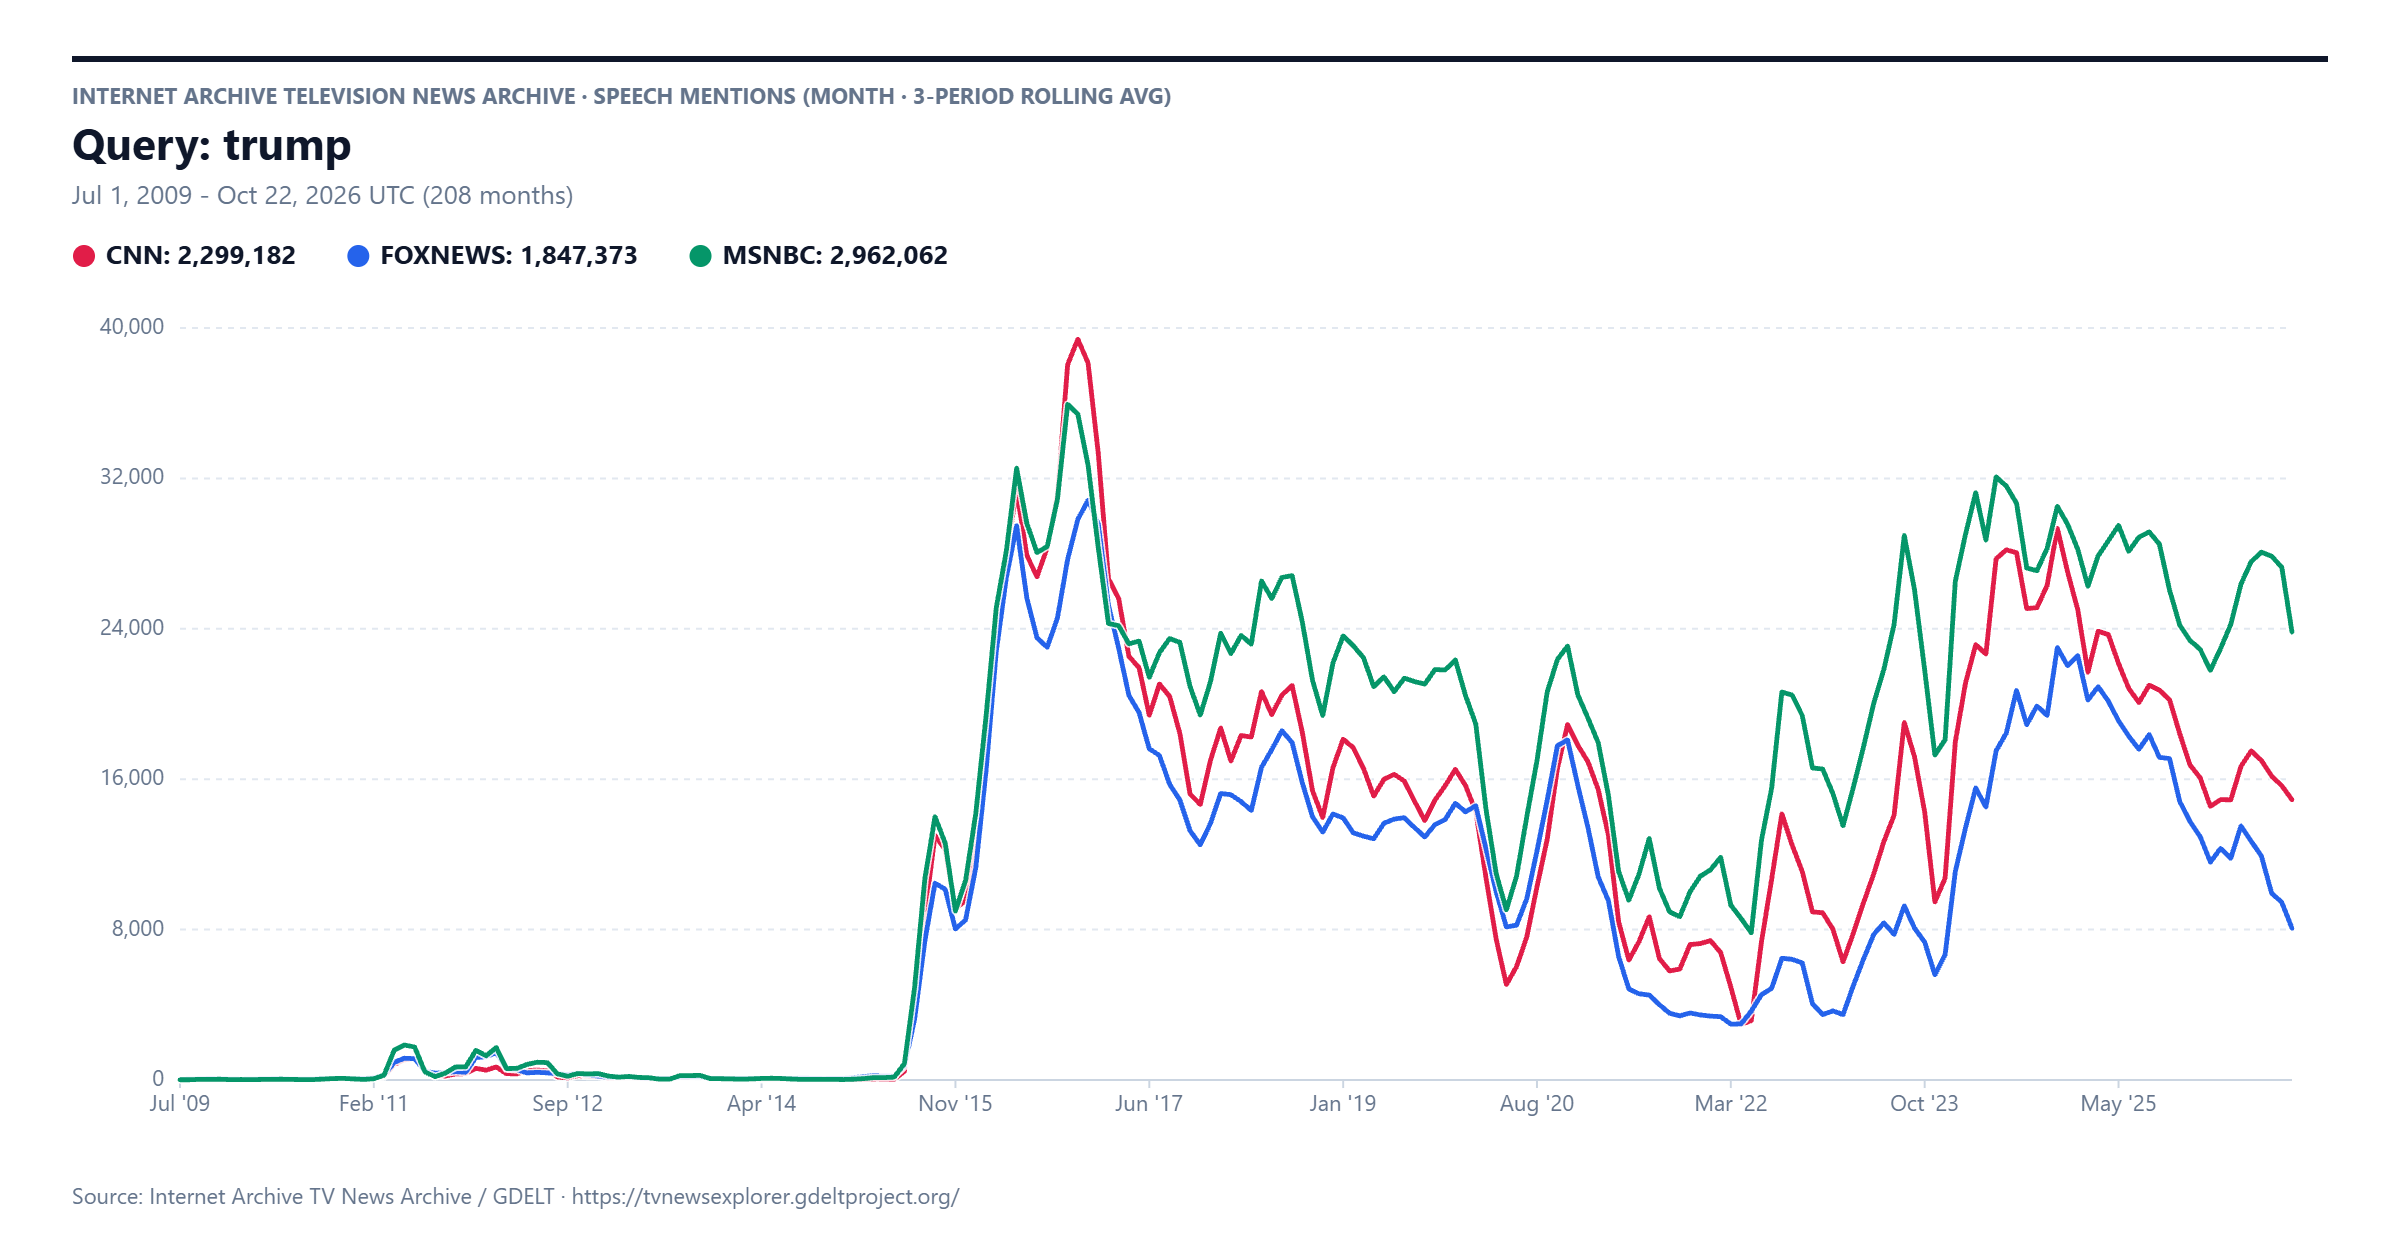 Instead, here is weekly / 3-week rolling average resolution again with a stacked barchart style. This makes the combined total coverage volume more understandable and makes it easier to understand how the three channels compare on a given week. However, the most significant finding of the above graphs (that MSNBC/MSNOW diverges from CNN and Fox News from Feb 2025) is largely lost in this stacked barchart view: it is clear that Fox News' coverage is less than MSNBC/MSNOW's in recent months, but this visual doesn't make the much higher coverage on MSNOW as visible:
Similarly, this streamgraph visual emphasizes the overall combined coverage ebbs and flows and makes Fox News' coverage decline more visible, but the Feb 2025 divergence doesn't leap out like it does in the line graph (although this style makes the reduced CNN coverage more apparent than the stacked barchart).