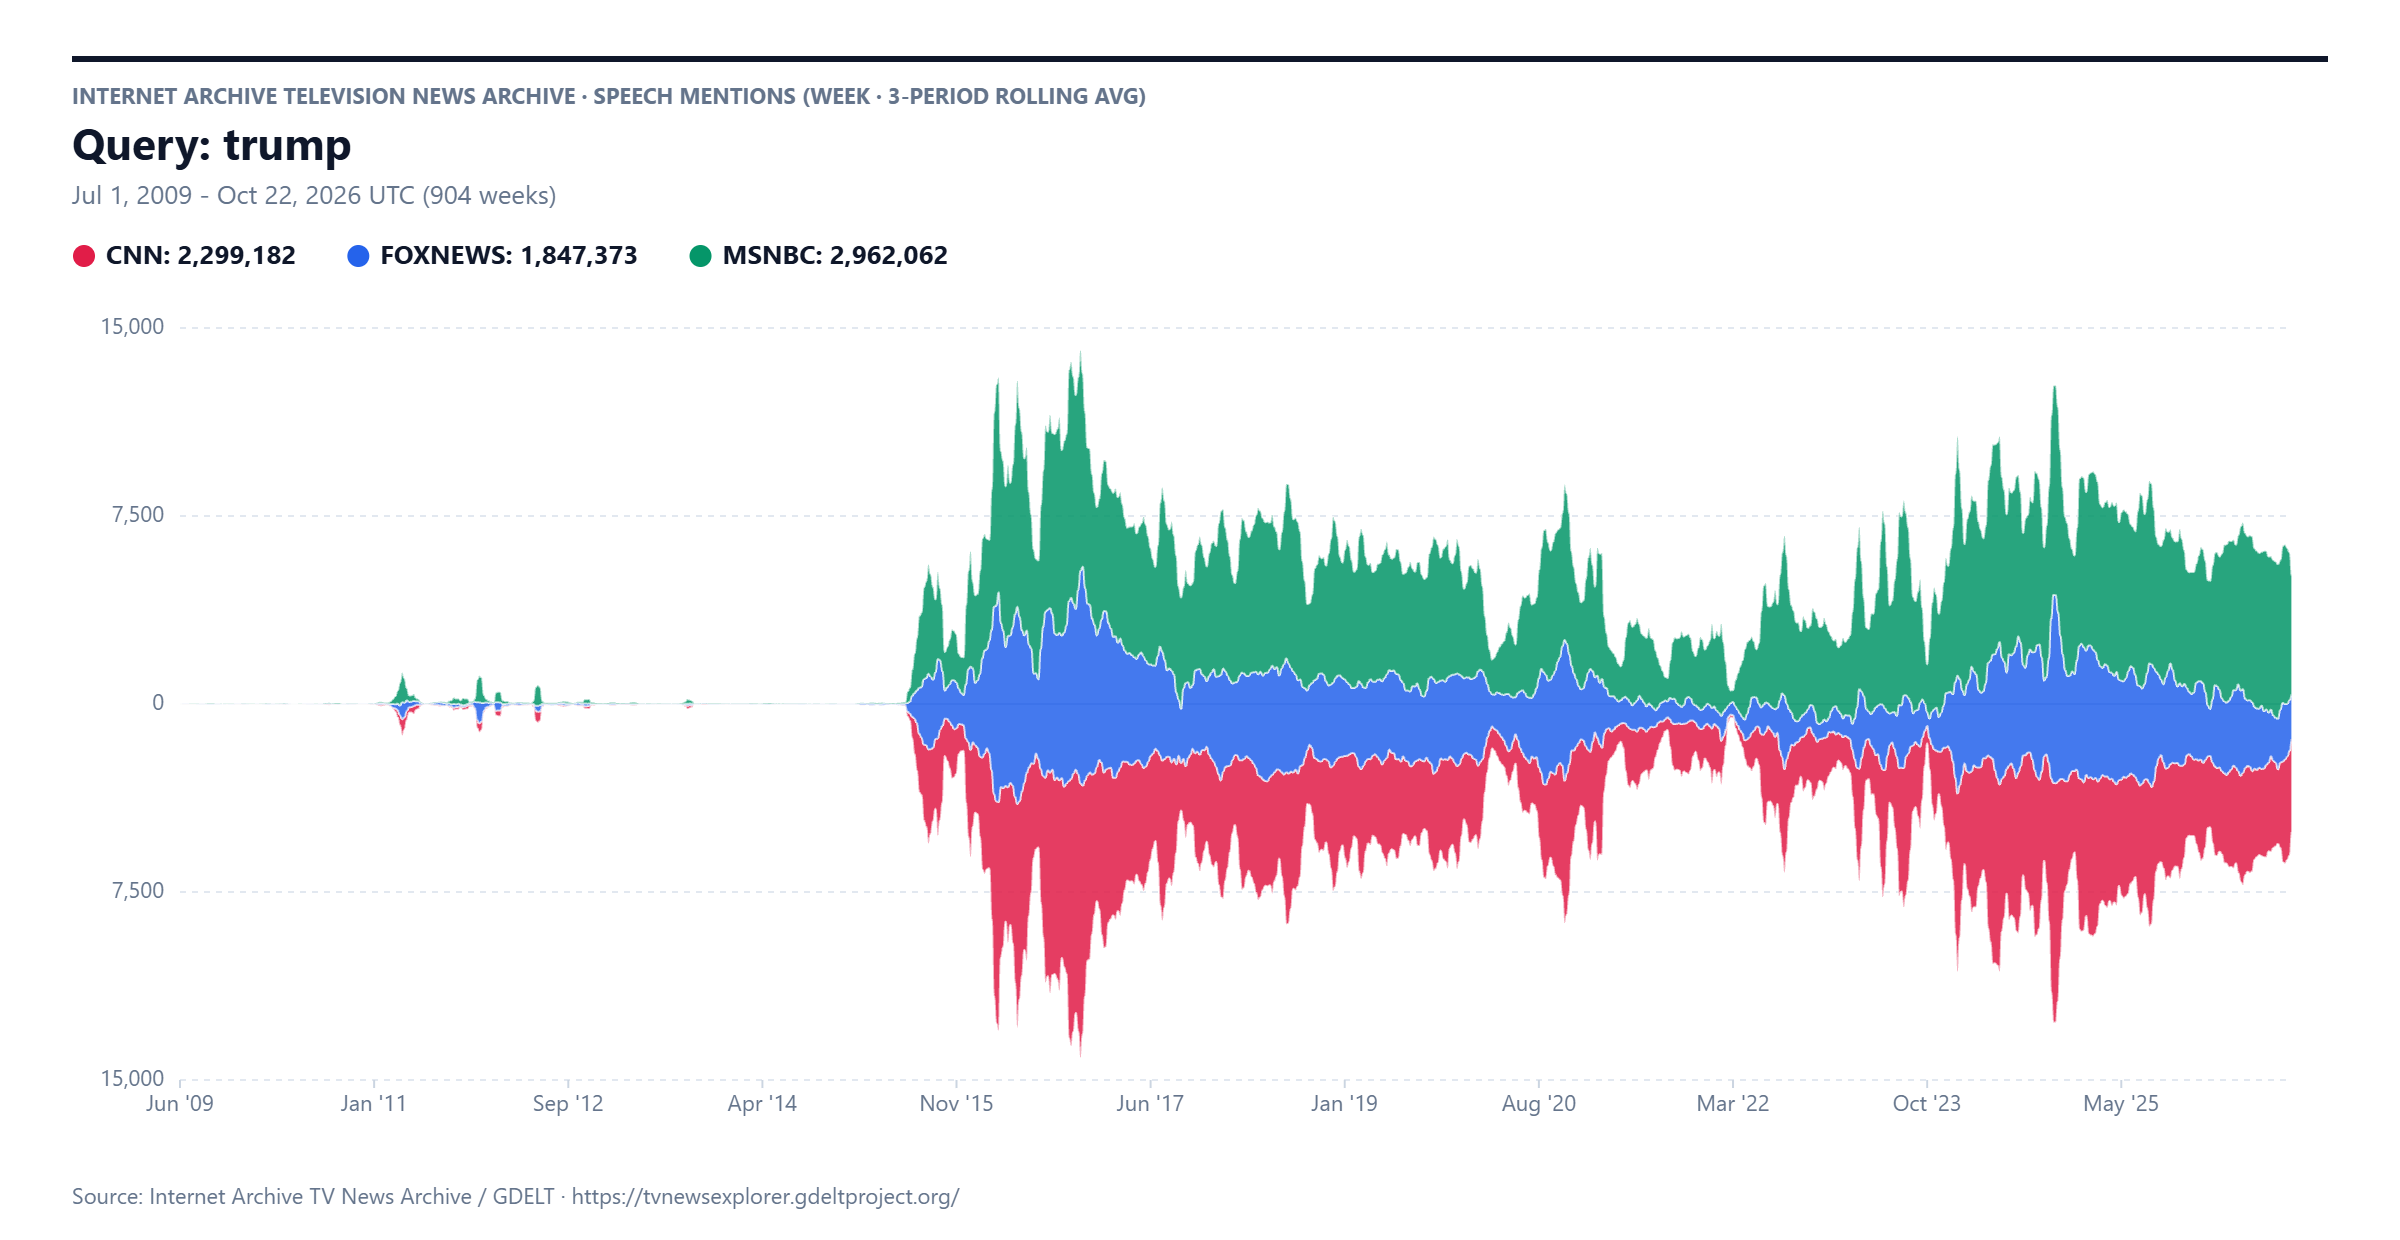
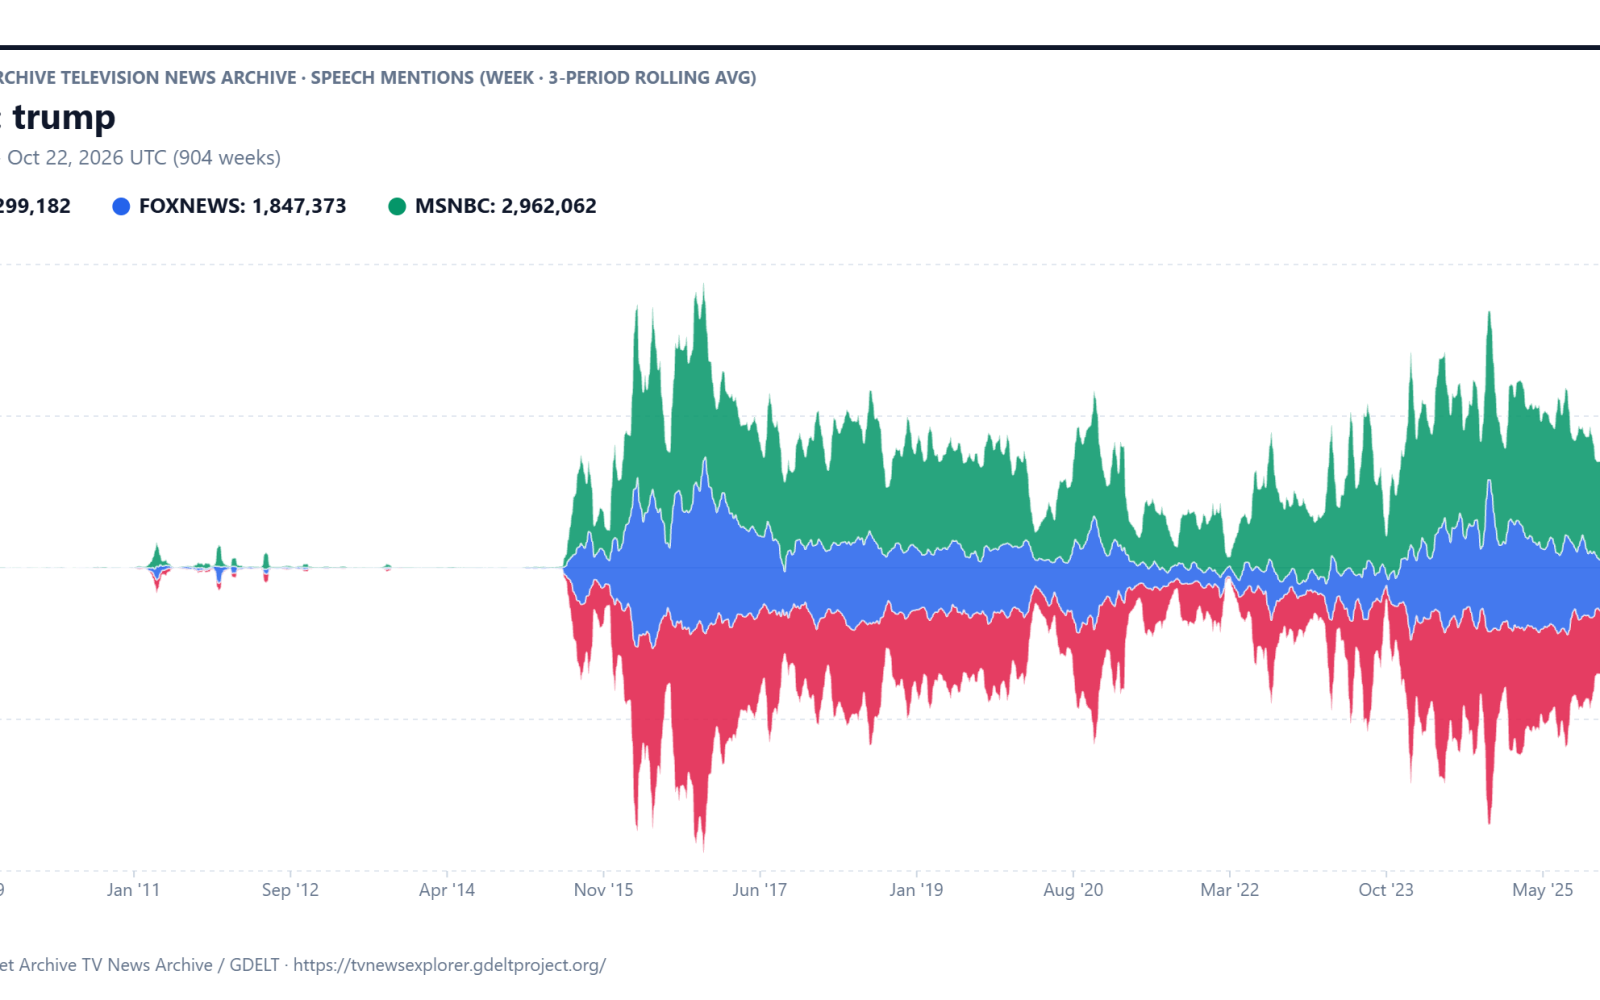
As of this morning we've added stacked barcharts and streamgraph visualization styles to the TV News Explorer's timeline display! This will make it easier to visualize the temporal trends of topics where the selected channels' coverage is highly correlated and thus a traditional line graph might otherwise obscure the important trends.
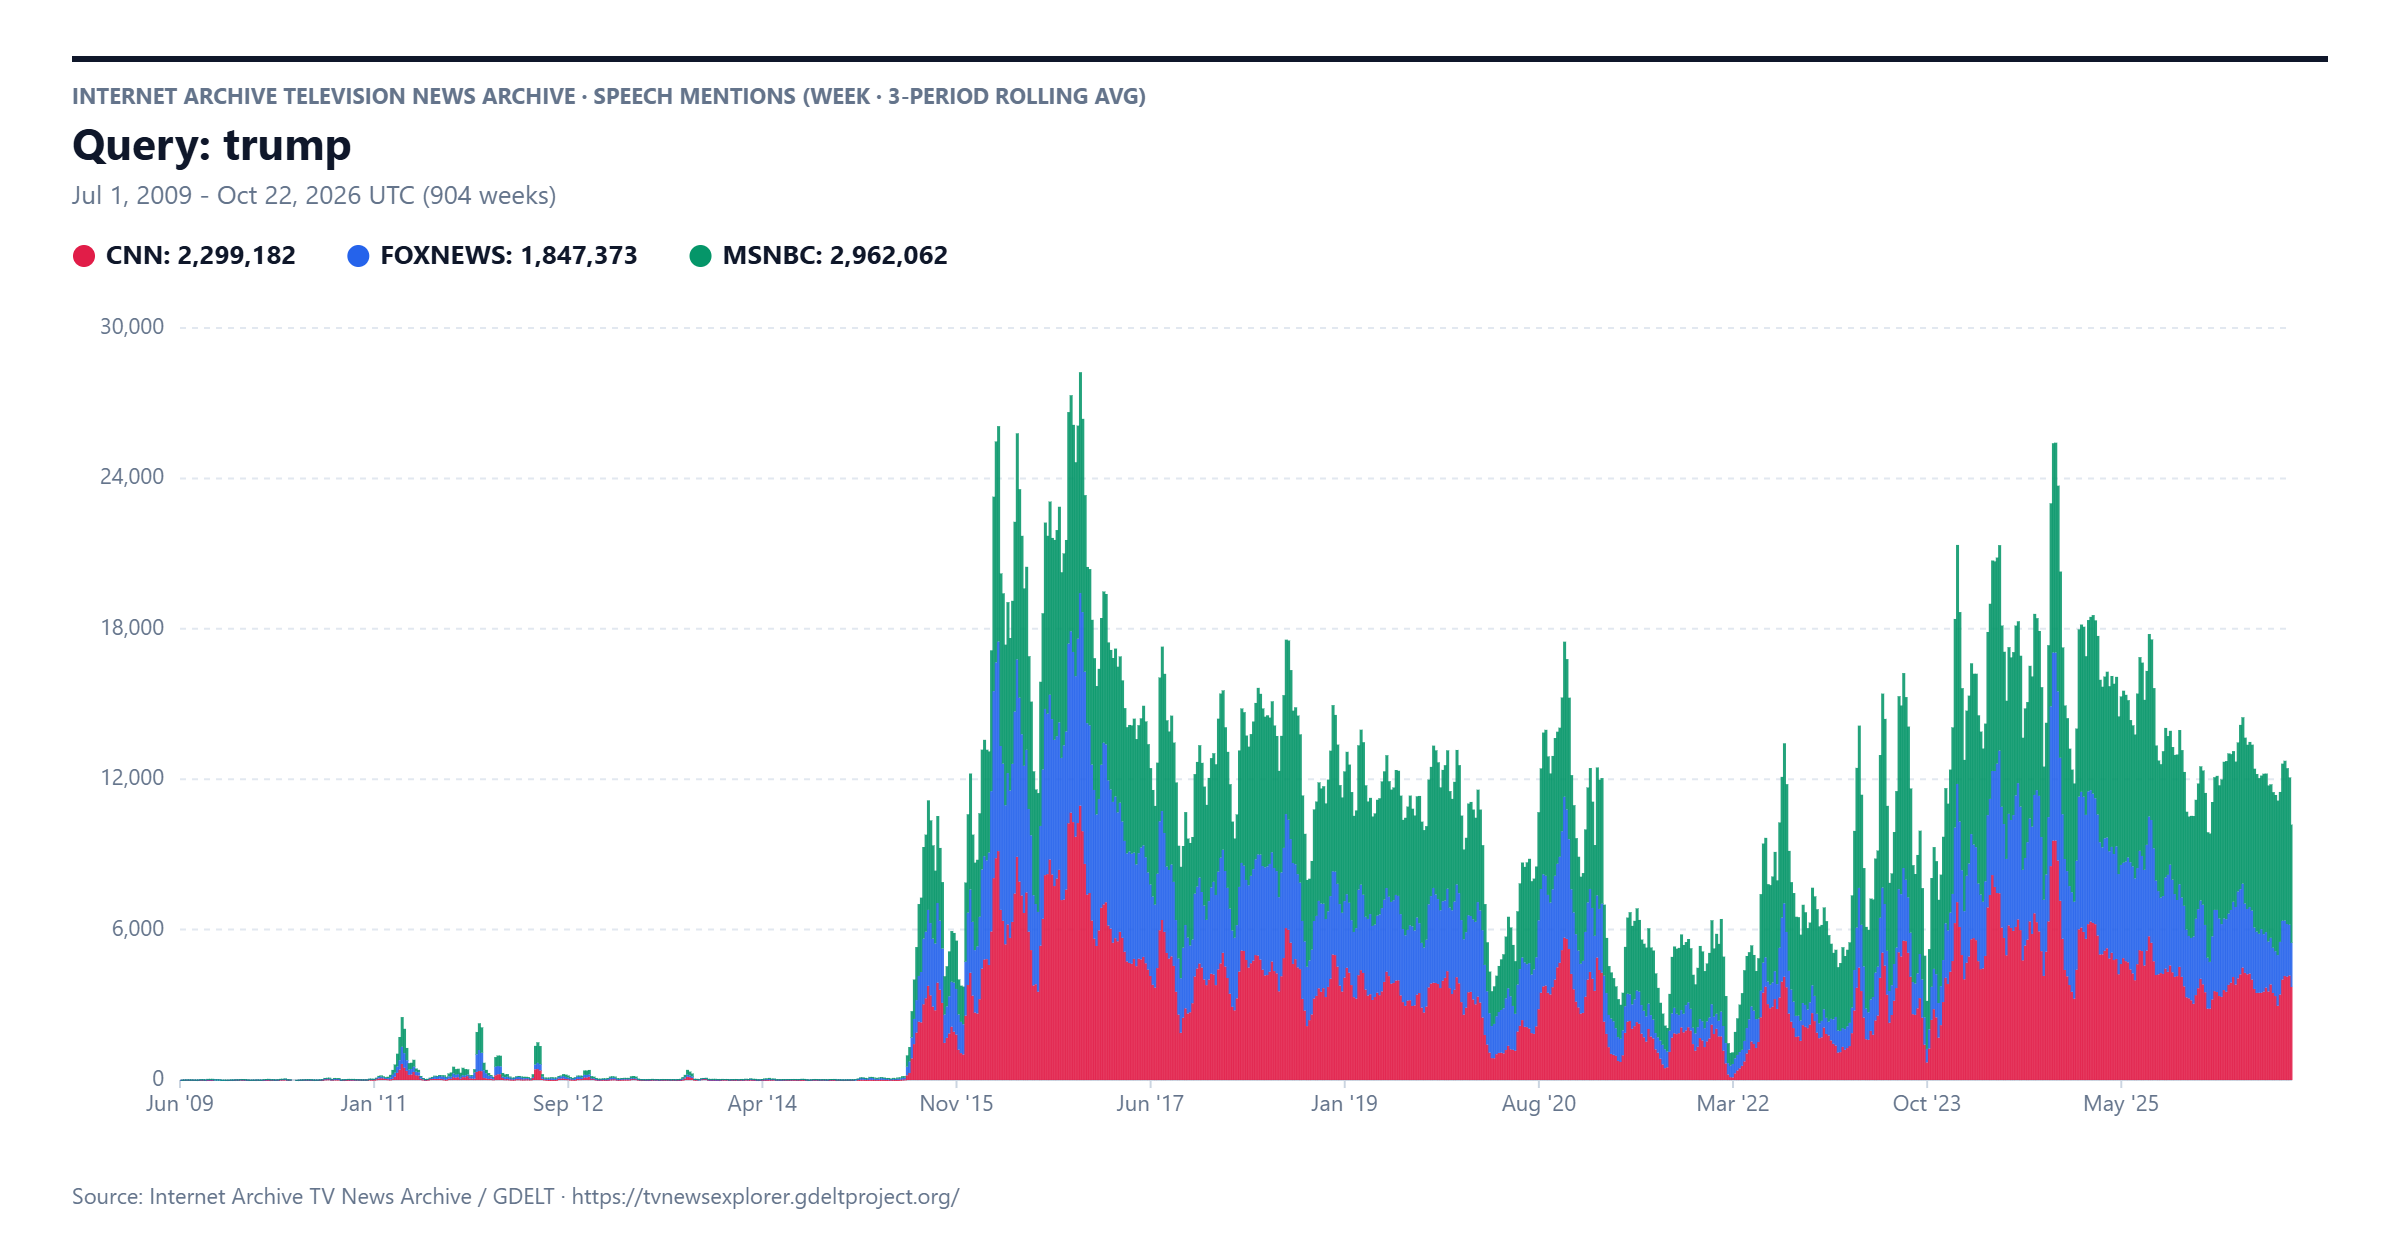
Here is a stacked barchart at weekly resolution with 3-week rolling average smoothing:
And streamgraph: