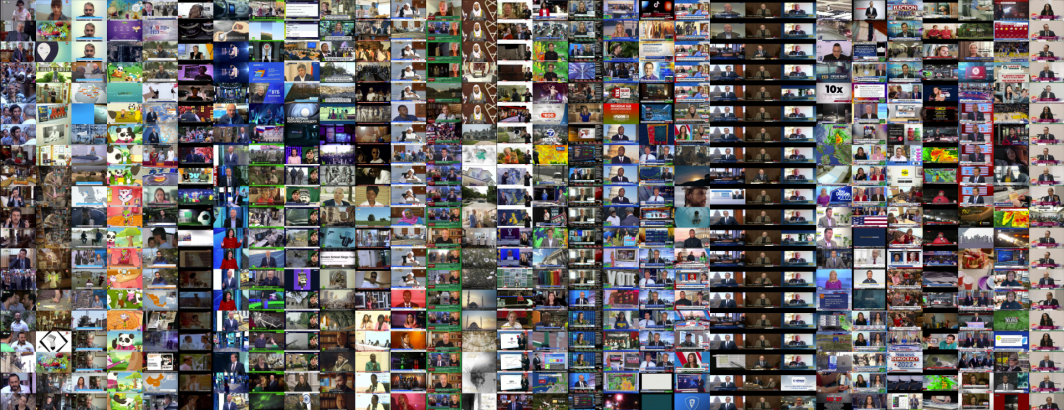
Using the Visual Explorer's new Visual Channel Comparer, earlier today we compared midterm 2022 coverage hour by hour across CNN, MSNBC and Fox News, showcasing the power of this side-by-side visualization. Given that the Internet Archive's Television News Archive spans dozens of active channels, what might it look like to visualize a single hour of television news across 30 channels of television news from around the world? To explore this question, we selected 8 to 9AM EST on November 8, 2022 (US midterm elections) and all currently active TV News Archive channels other than RTPI, KSTS, KQED and KDTV, which did not have monitored coverage during the 8-9AM EST period on that day (for some channels, only selected programming is monitored). In all, exactly 30 channels are included in this montage. Each column represents one channel in the order seen in the code below, with each row representing one minute of airtime.
You can see the actual code used to produce the image below:
#install the libraries we need...
apt-get -y install imagemagick
apt-get -y install parallel

#download the comparer script...
wget https://storage.googleapis.com/data.gdeltproject.org/blog/2022-tv-news-visual-explorer/vechancompare.pl
chmod 755 vechancompare.pl

mkdir /dev/shm/tmp
export MAGICK_TEMPORARY_PATH=/dev/shm/tmp/
time ./vechancompare.pl 20221108130000 20221108140000 CANALALGERIE,BELARUSTV,DW,JORDANTV,ALJAZ,TELECONGO,1TV,NTV,RUSSIA24,RT,SOUTHERNSUDAN,SUDAN,ESPRESO,SHARJAHTV,BBCNEWS,KGO,BLOOMBERG,KPIX,CNBC,CNN,CSPAN,CSPAN2,CSPAN3,KTVU,FBC,FOXNEWS,KRON,MSNBC,KNTV,SFGTV 300x175 60 && mv MONTAGE.jpg
montage-multiworldus-20221108130000-20221108140000-60s.jpg
We're tremendously excited by the potential of this new visualization approach and would love to hear your thoughts! You can see the final image below.