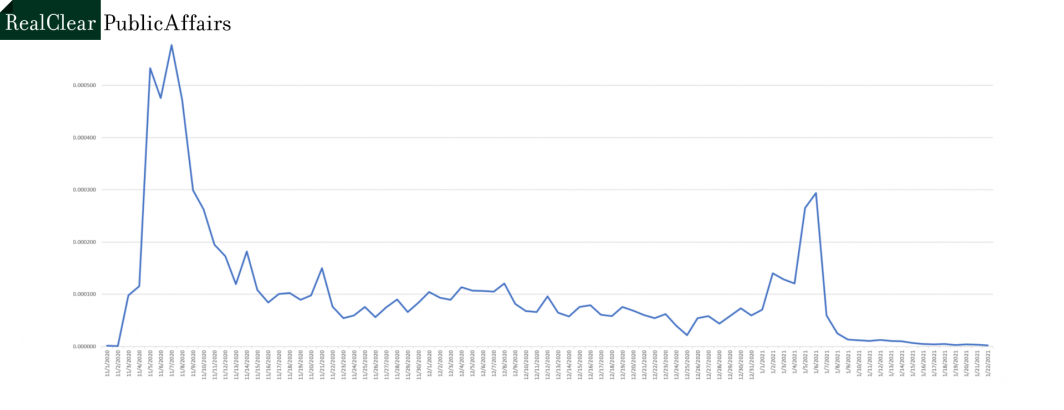
The graphs below trace select Twitter hashtags using data from Indiana University's Observatory on Social Media, tracing the percentage of daily tweets containing that hashtag. Other than #StopTheSteal which didn't begin until November 2020, all graphs run February 1, 2018 through January 22, 2021.