Over the last few days we have demonstrated the incredible potential of translating the legislation, hearings, reports and other output of the US Government into infographics to make the dense and jargon-filled language of governance and democracy accessible to the general public. Could state and local governments use this same model to make their legislation and hearings more accessible to their constituents? Here we transform state-level legislation from California, Illinois and Virginia and local San Francisco government meetings into infographics, demonstrating the immense potential of this work for communicating the functioning of state and local governments.
Only the public enterprise Gemini and Nano Banana APIs were used and no data was used to train or tune any model. The results below present the output of Nano Banana Pro as-is without any post editing and may contain errors.
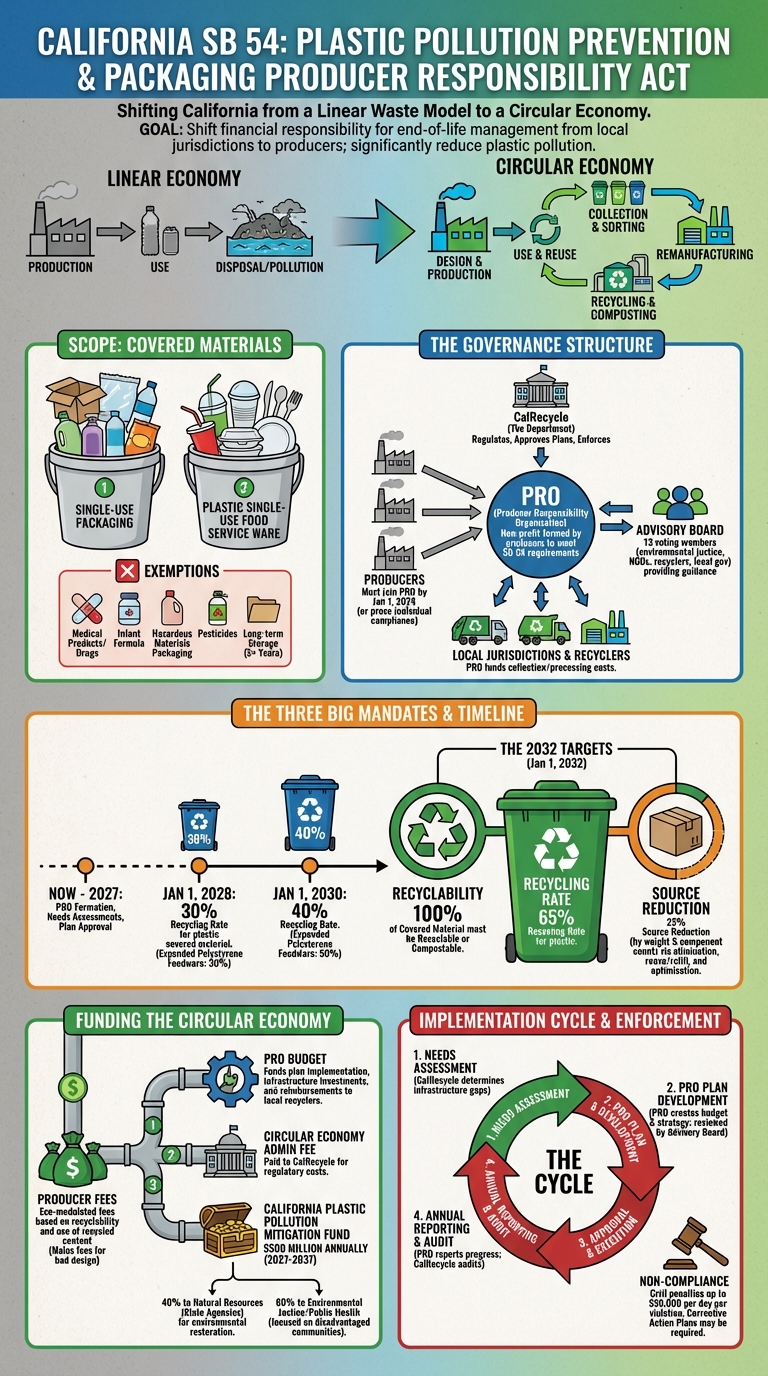
How might state governments translate their legislation into easy-to-understand infographics? Let's visualize California Senate Bill 54 using the same Nano Banana Pro prompt we've been using thus far:
Give me a prompt to create a large illustrated explainer poster designed to be printed on a large-format poster printer and hung up on the wall that narrates the attached briefing as a single large poster that can be printed and hung on a wall that outlines all of the core details.
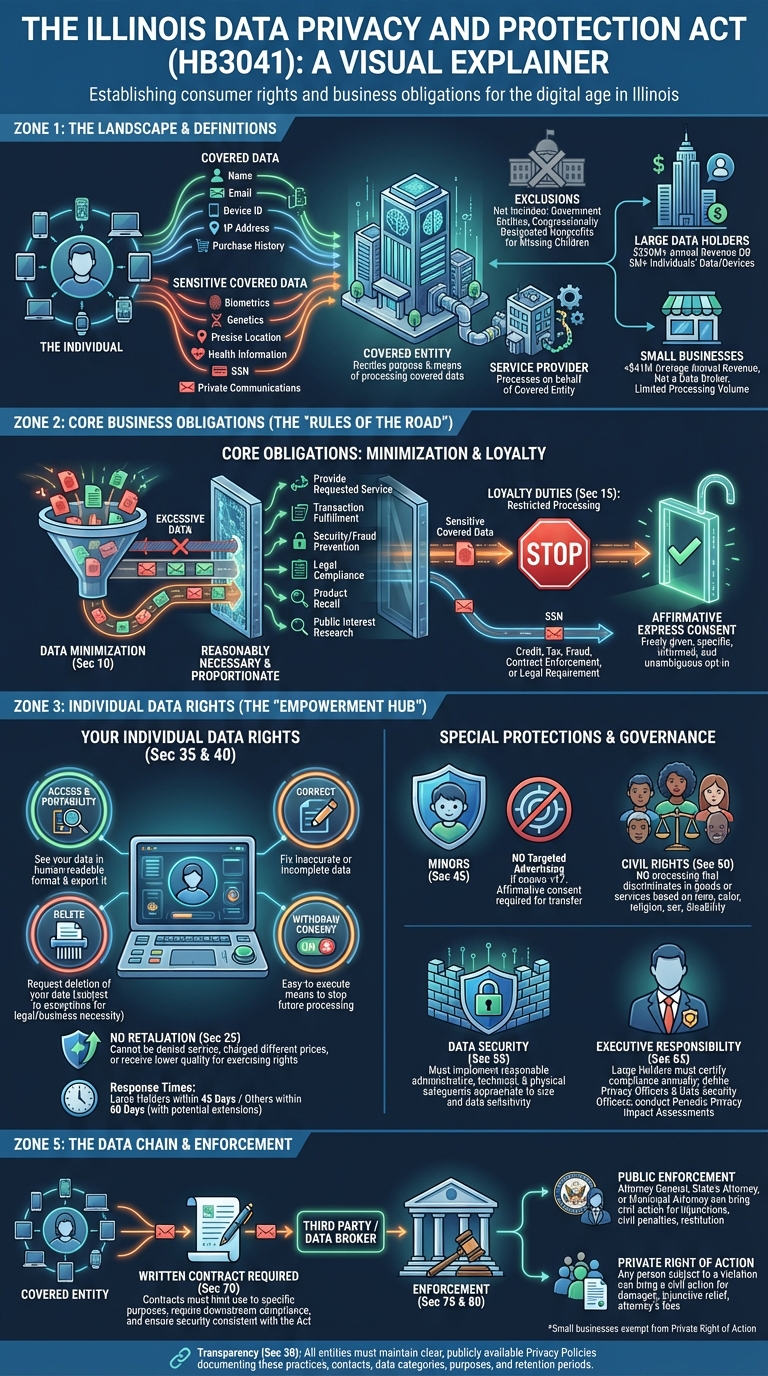
How about the Illinois Data Privacy and Protection Act (HB3041)?
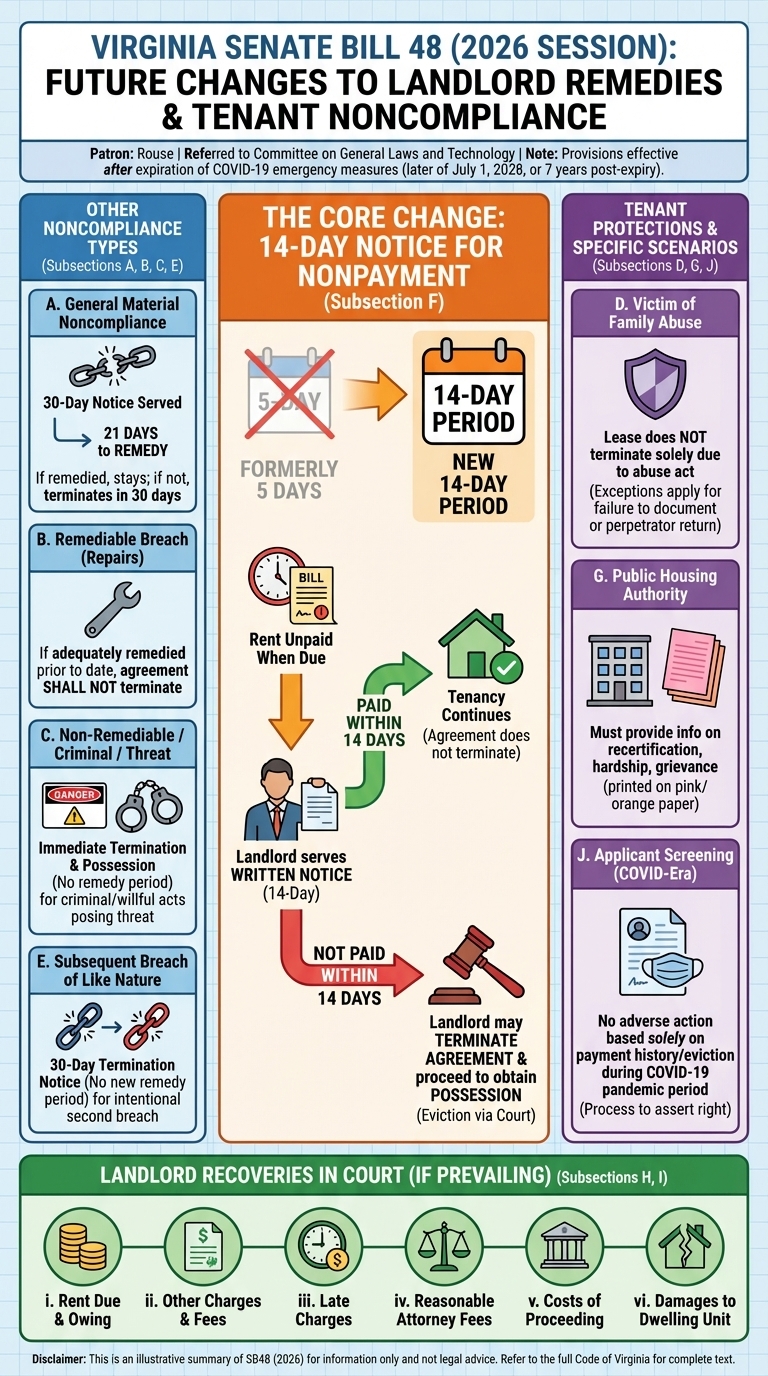
Or the Virginia Residential Landlord And Tenant Act (SB48)?
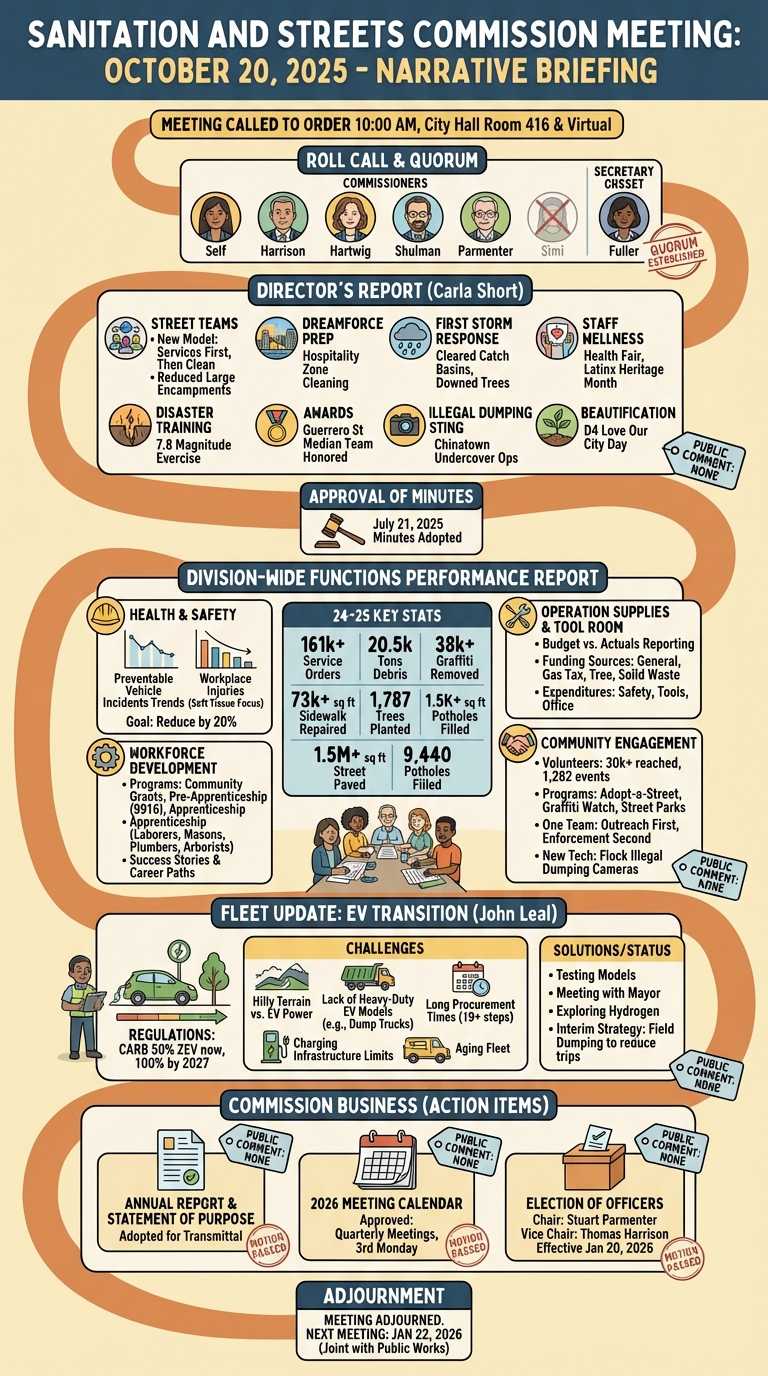
What about the functioning of local government? Let's turn this two-and-a-half-hour San Francisco Government (SFGovTV) broadcast of the Sanitation And Streets Commission meeting into an infographic.
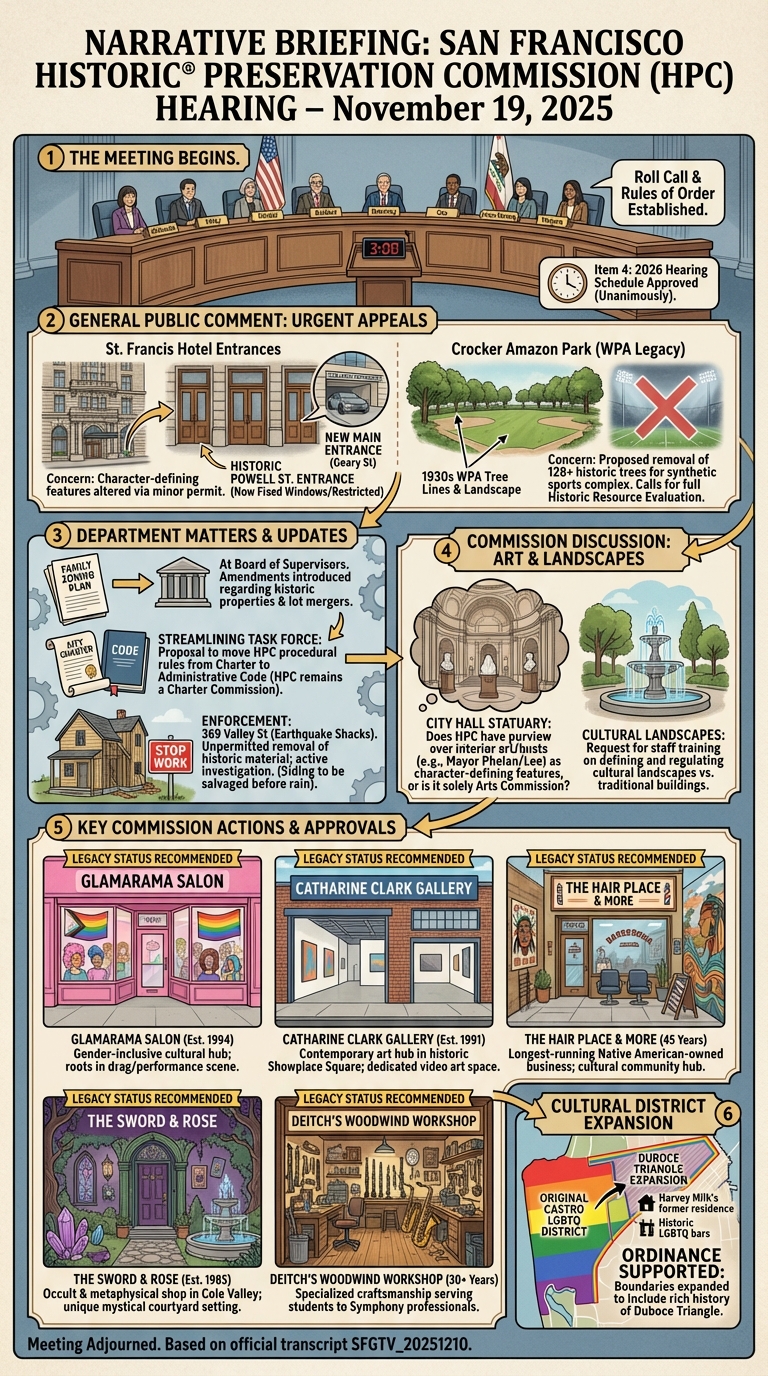
How about the San Francisco Government Historic Preservation Commission meeting?
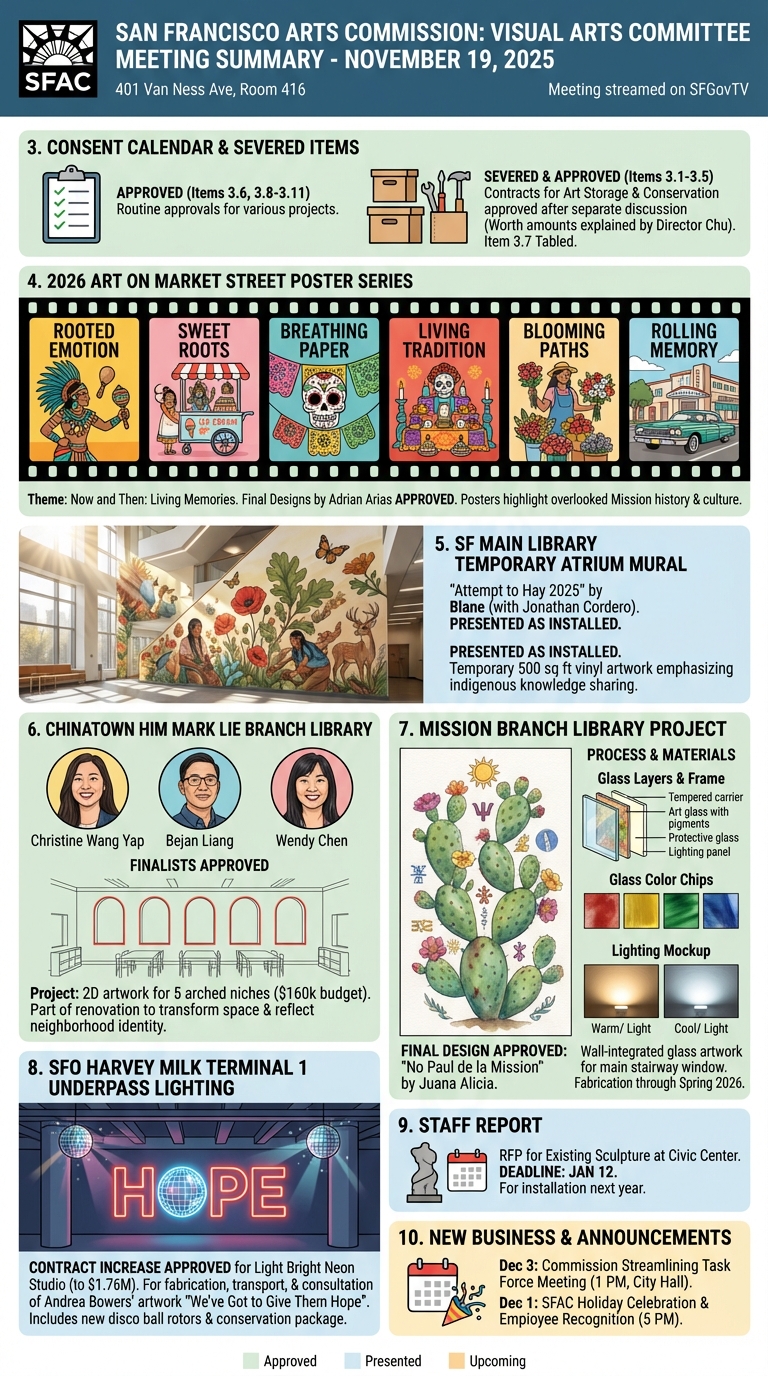
How about the San Francisco Government Visual Arts Committee meeting?
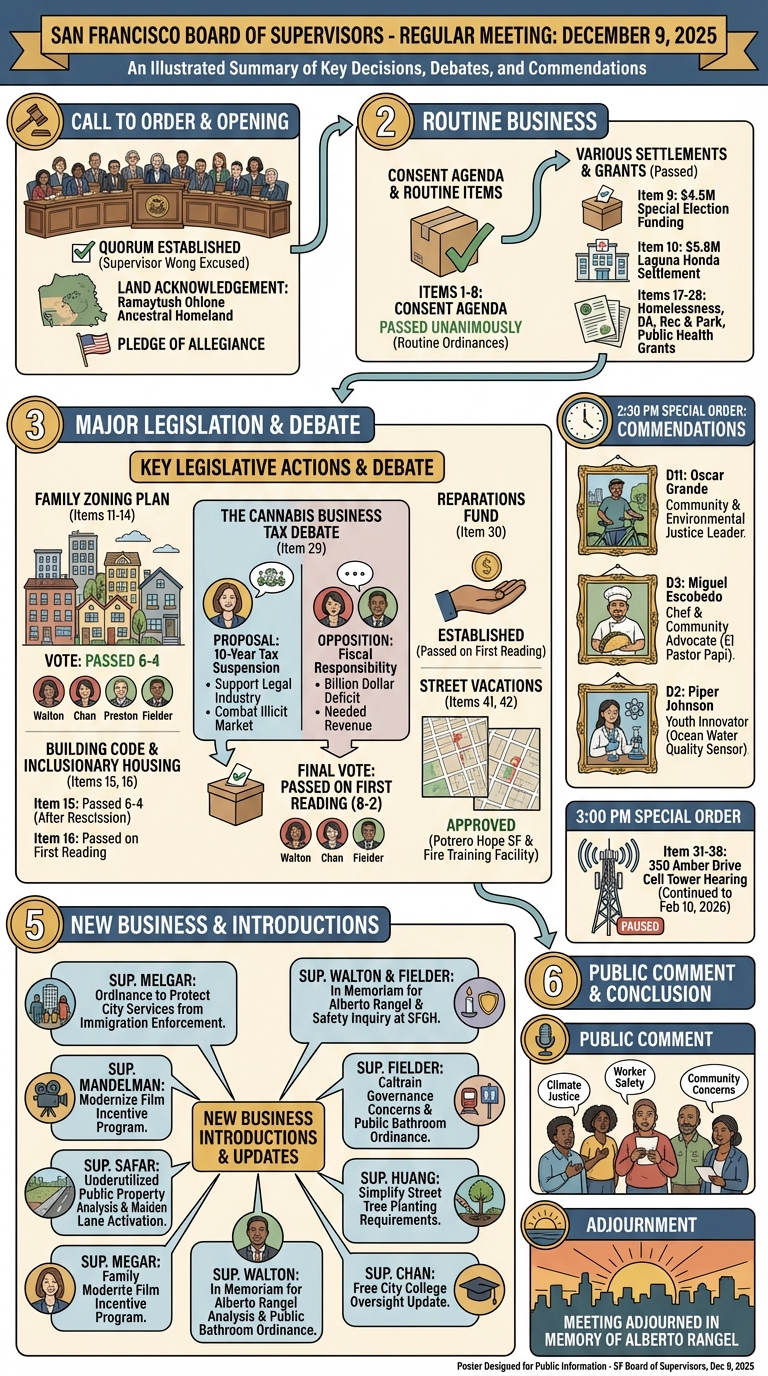
What about the San Francisco Government Full Board of Supervisors meeting?