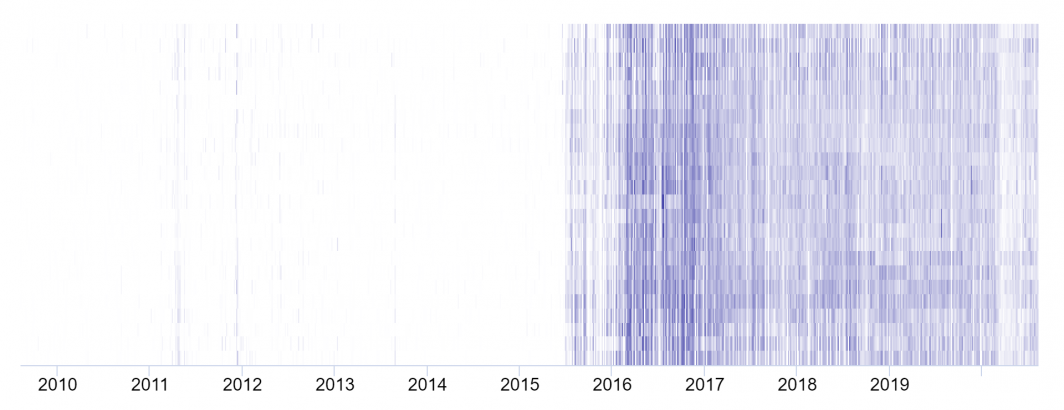
The TV 2.0 API now supports the new hourly heatmap visualization! This display shows an hourly timeline of total airtime seconds matching the query, rapidly pinpointing hourly trends, where the X axis is days and Y axis is hours from 0 to 23. Each cell is color-coded from white (0) to dark blue (maximum value). Note that this visualization is very computationally expensive and thus may take several seconds or longer to return.