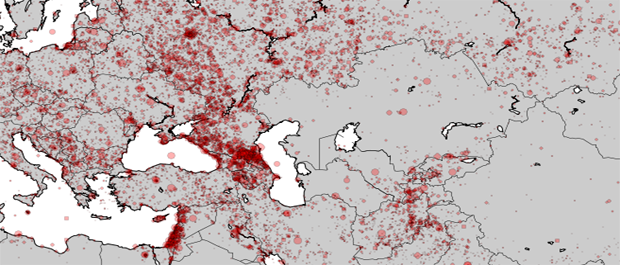
David Masad of George Mason University put together this great tutorial demonstrating how to replicate some of Rolf Fredheim's R-based visualizations for those more familiar or comfortable with Python. He creates some really impressive publication-ready visuals and includes all of the source code used to create them, along with copious documentation and discussion, making it easy to get started mapping GDELT.