Could we take the same incredible infographic approach we've been using to visualize the functioning of government and apply it to the news domain, to create visual table of contents infographics for television news broadcasts from around the world in all the world's languages that succinctly and compellingly list what stories are covered in that broadcast, allowing researchers and scholars to instantly understand the general topical focus of each broadcast? These aren't "summaries" of broadcasts, but rather a high-level visual table of contents of what stories are covered in each broadcast to allow a researcher or scholar to know that a particular broadcast covers a given story they are interested in. In short, could we take a television news broadcast from any country in any language and create an infographic in English (regardless of what language the broadcast is in) that acts as a visual table of contents of what stories are covered in that broadcast? Importantly, could we provide a transcript in the broadcast's original language and get back an English-language infographic, regardless of what language the broadcast was in? The answer, as seen in the astonishing results below, is yes and suggests there is tremendous potential for journalists to make use of this powerful new technology.
Only the public enterprise Gemini and Nano Banana APIs were used to create the images below and no data was used to train or tune any model. Nano Banana Pro was provided the original language ASR transcript generated by Google's Chirp 1 ASR model. The results below present the direct output of Nano Banana Pro as-is without any human editing and thus may contain errors and are presented only as a research experiment exploring the potential of such infographic workflows for journalism. Note that while the images below were completely machine-generated without any human post editing, Nano Banana Pro allows interactive human editing of the generated infographic, meaning that in a real-world journalism use case, a journalist or visual editor could interactively correct the infographic to eliminate any errors and to steer its visual depictions.
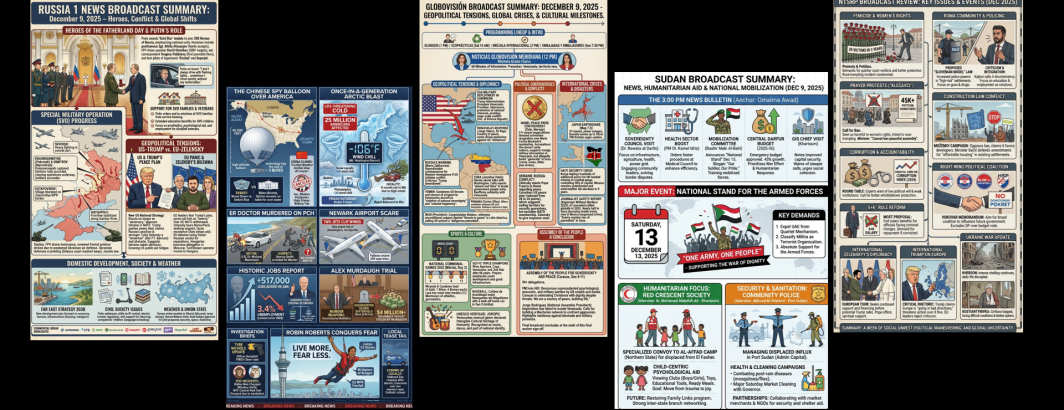
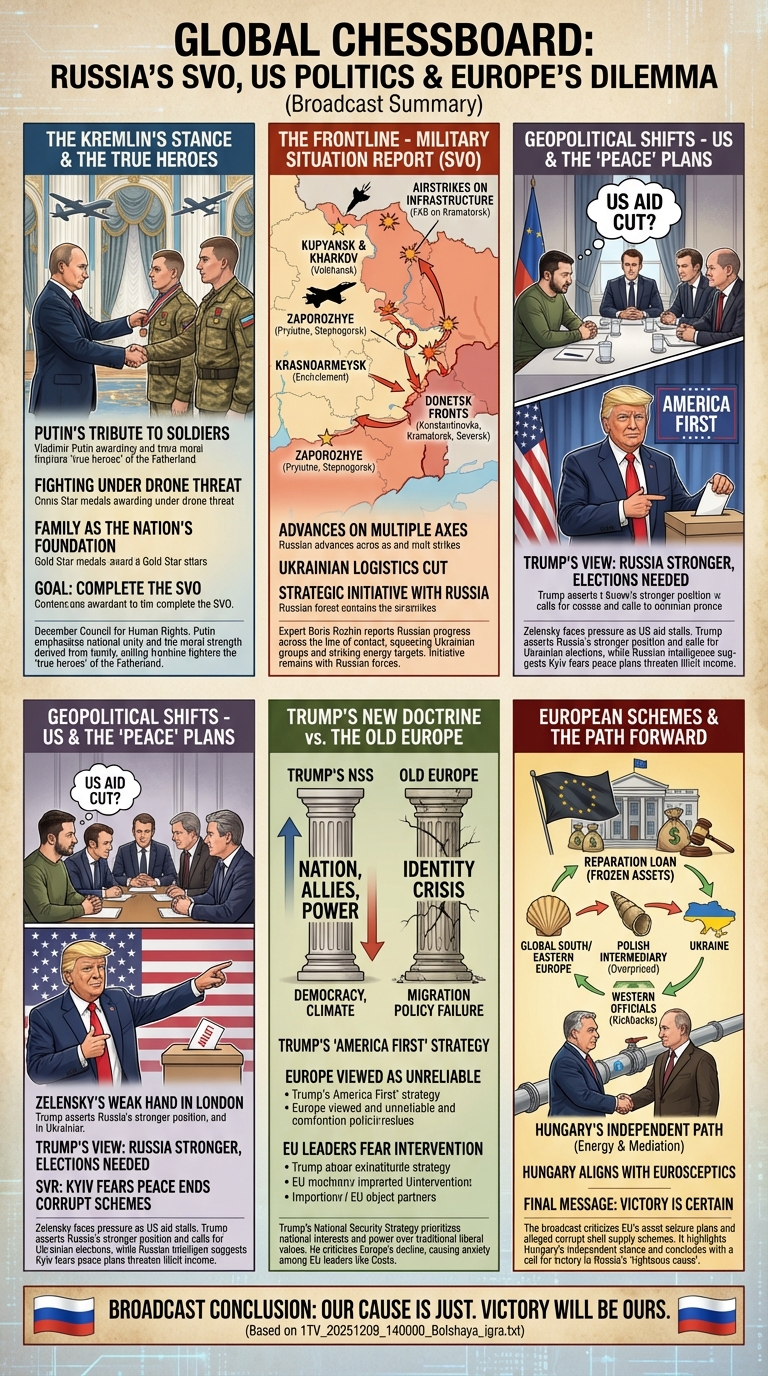
Russia Channel 1 Bolshaya Igra: December 9, 2025
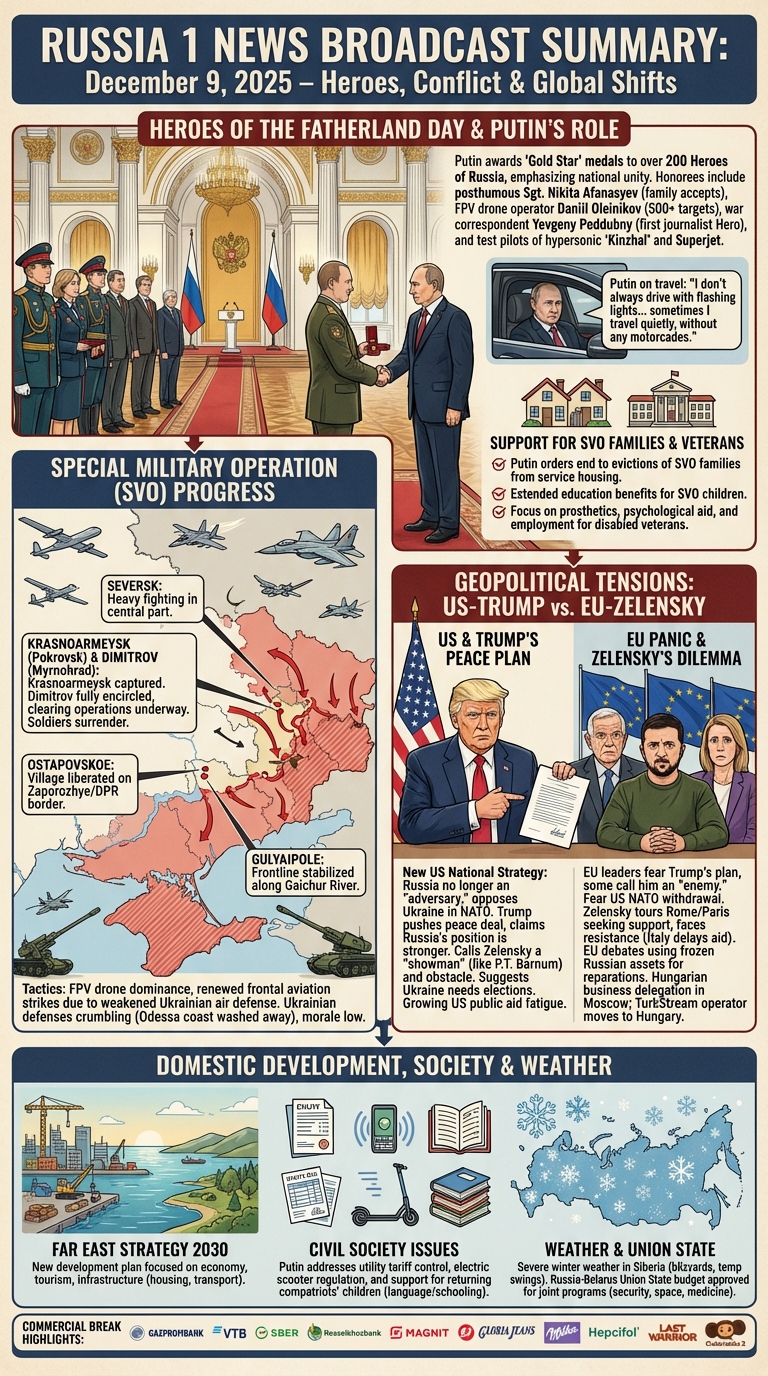
Russia 1 Vesti: December 9, 2025
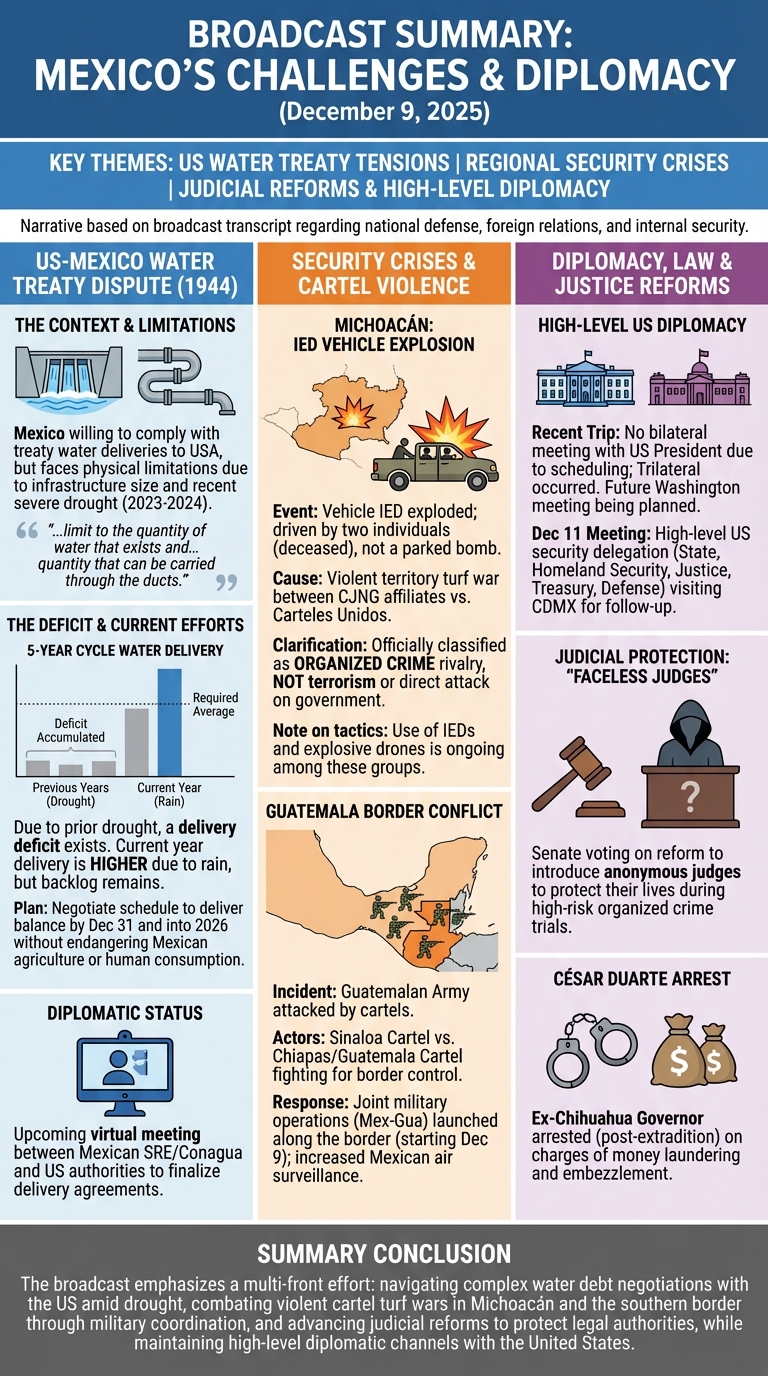
CANALCATORCE: December 9, 2025
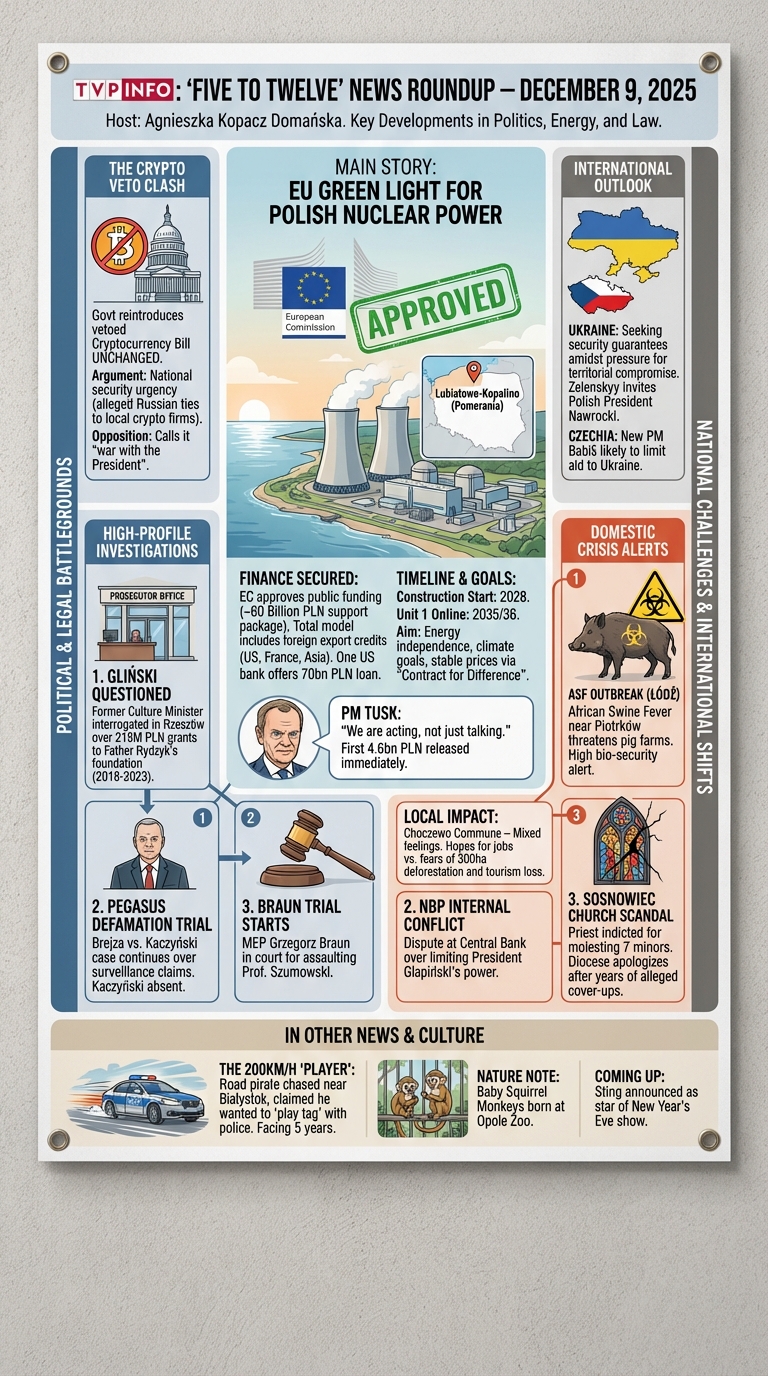
Poland TVPINFO Five to Twelve: December 9, 2025
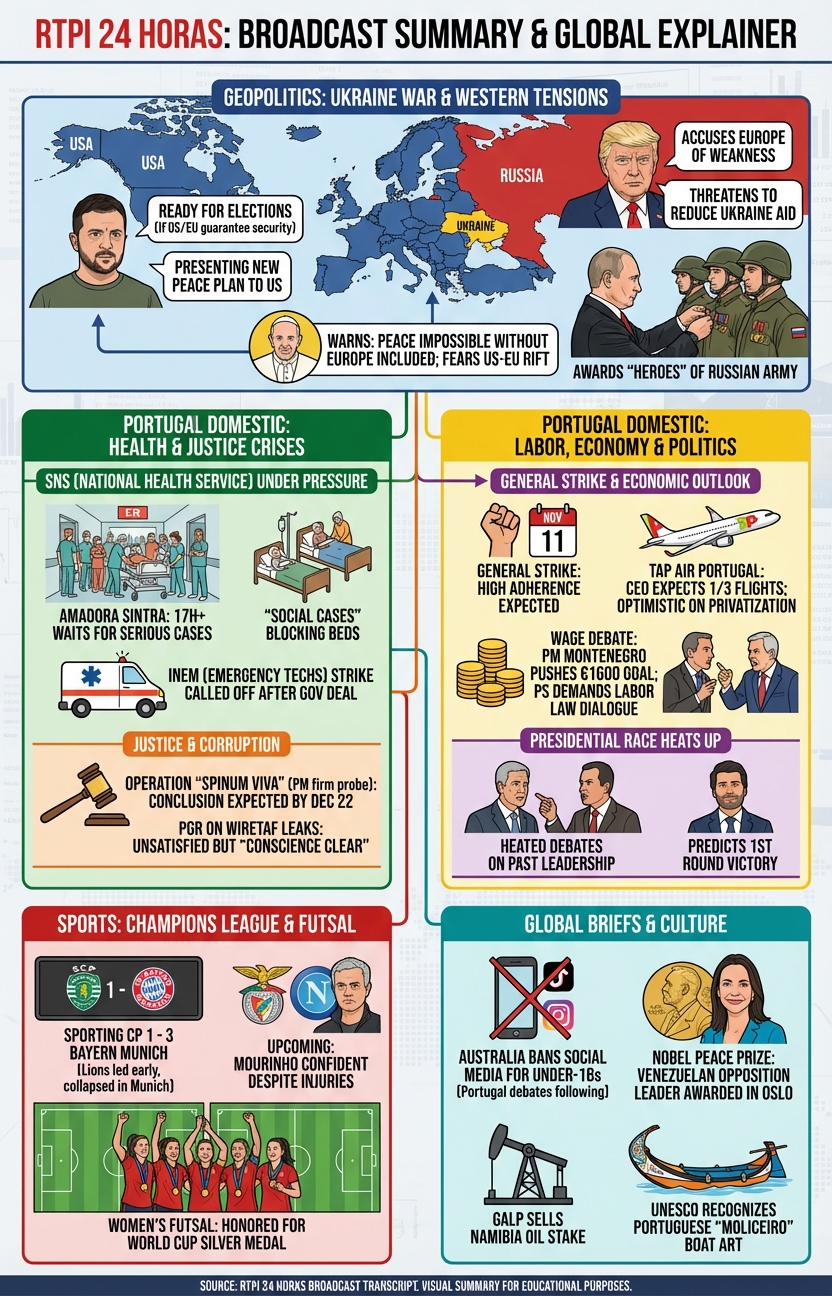
Portugal RTPI: 24 Hours: December 9, 2025
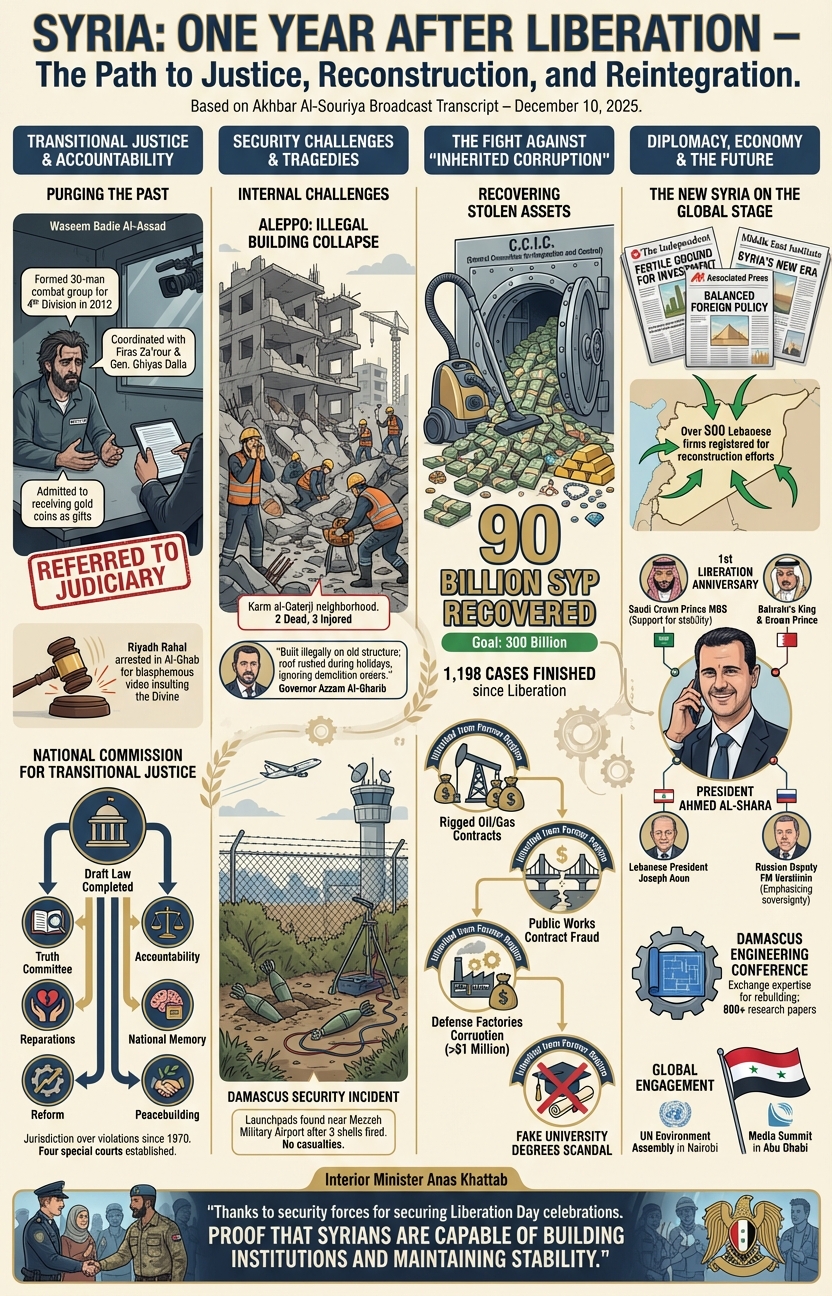
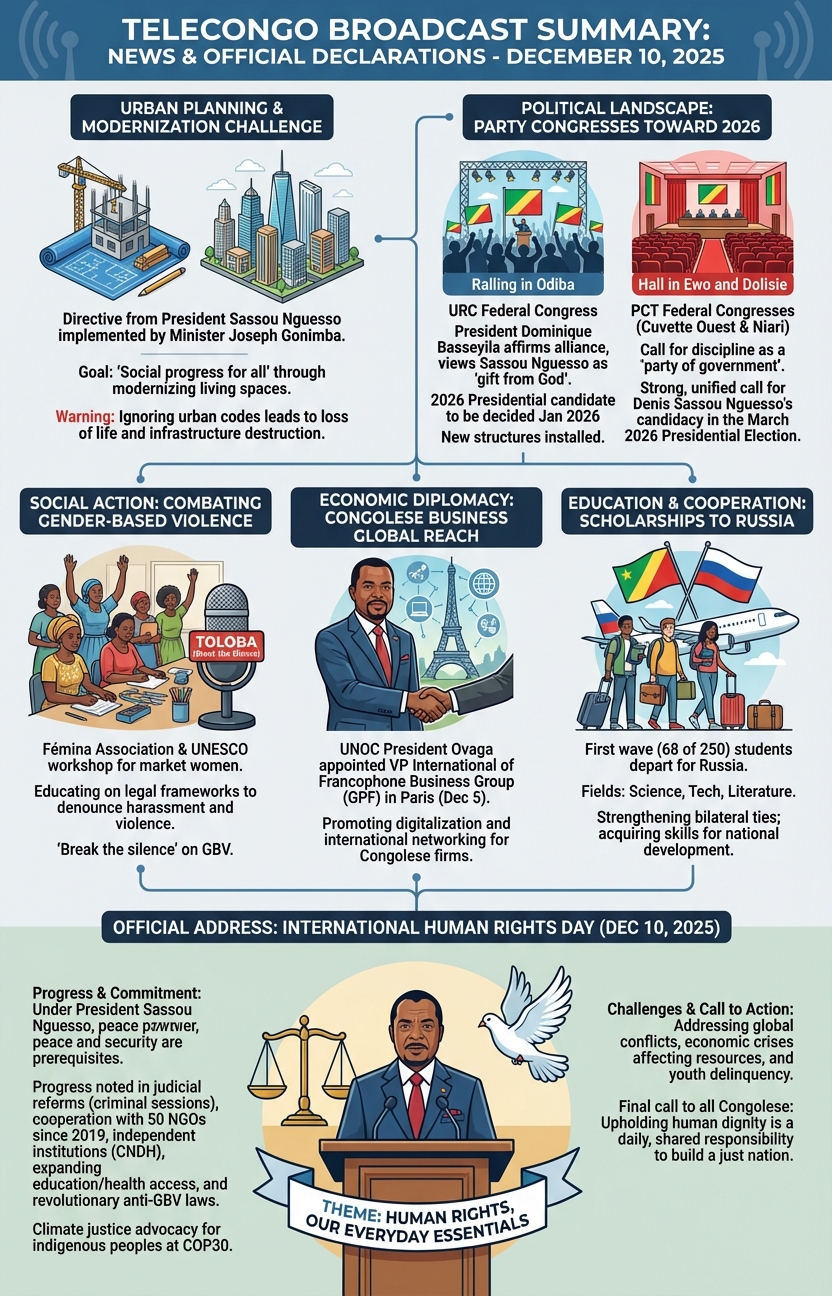
Republic of Congo TELECONGO: December 10, 2025
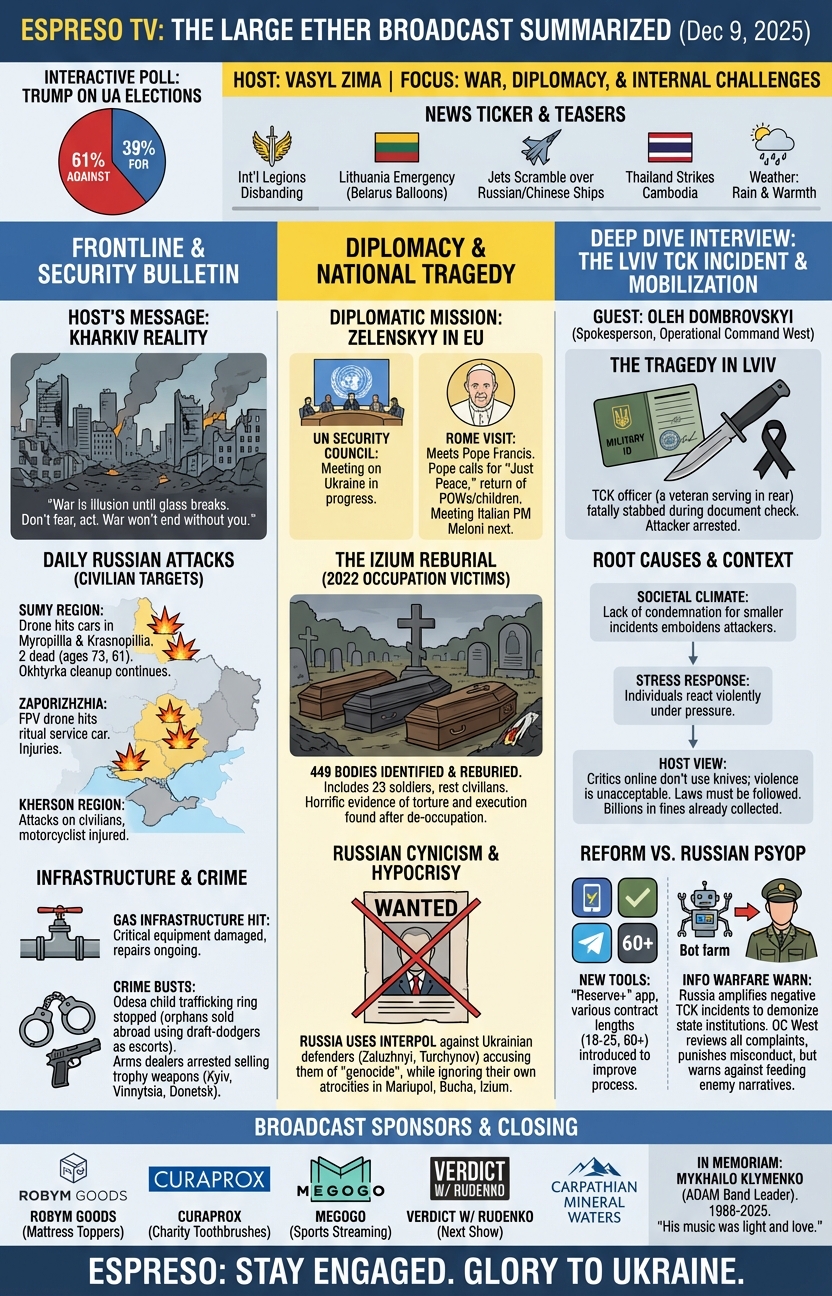
Ukraine ESPRESO: December 9, 2025
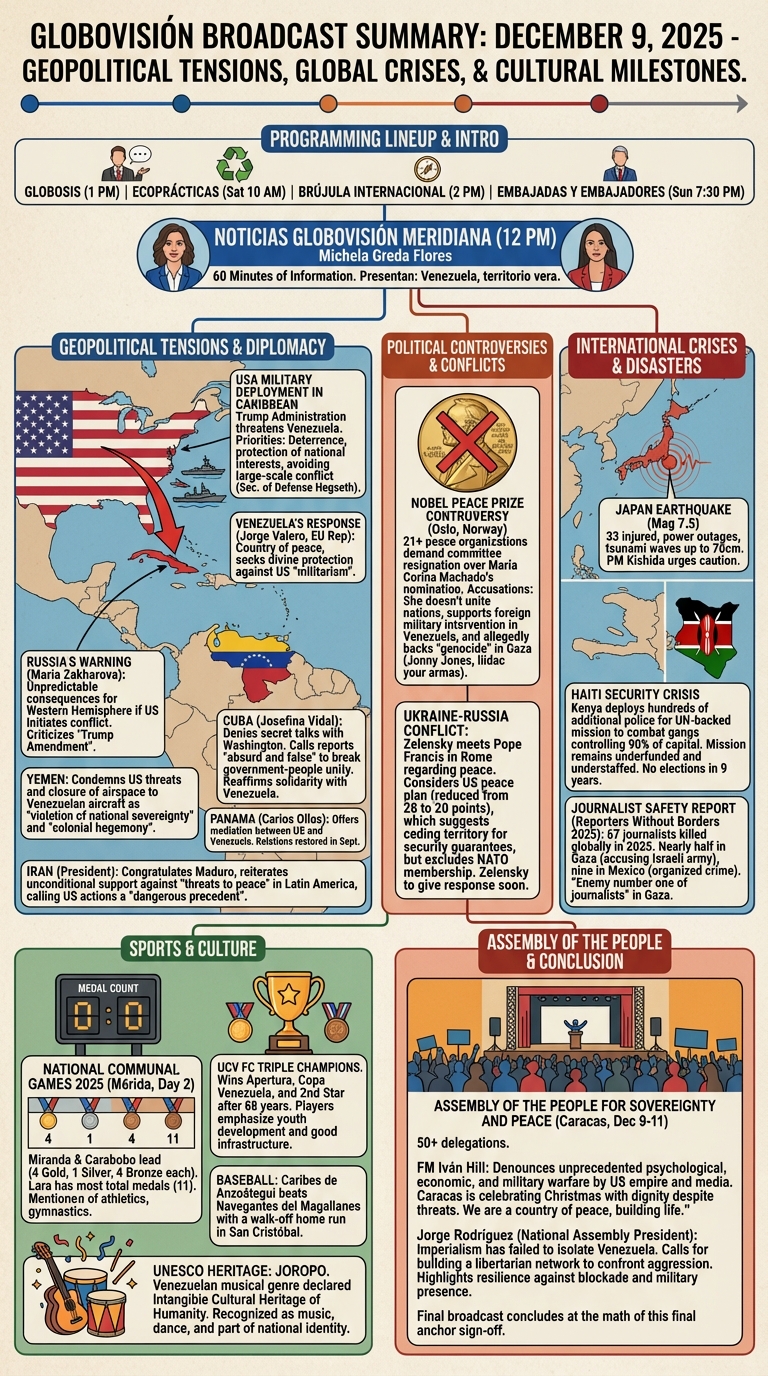
Venezuela GLOBOVISION: December 9, 2025
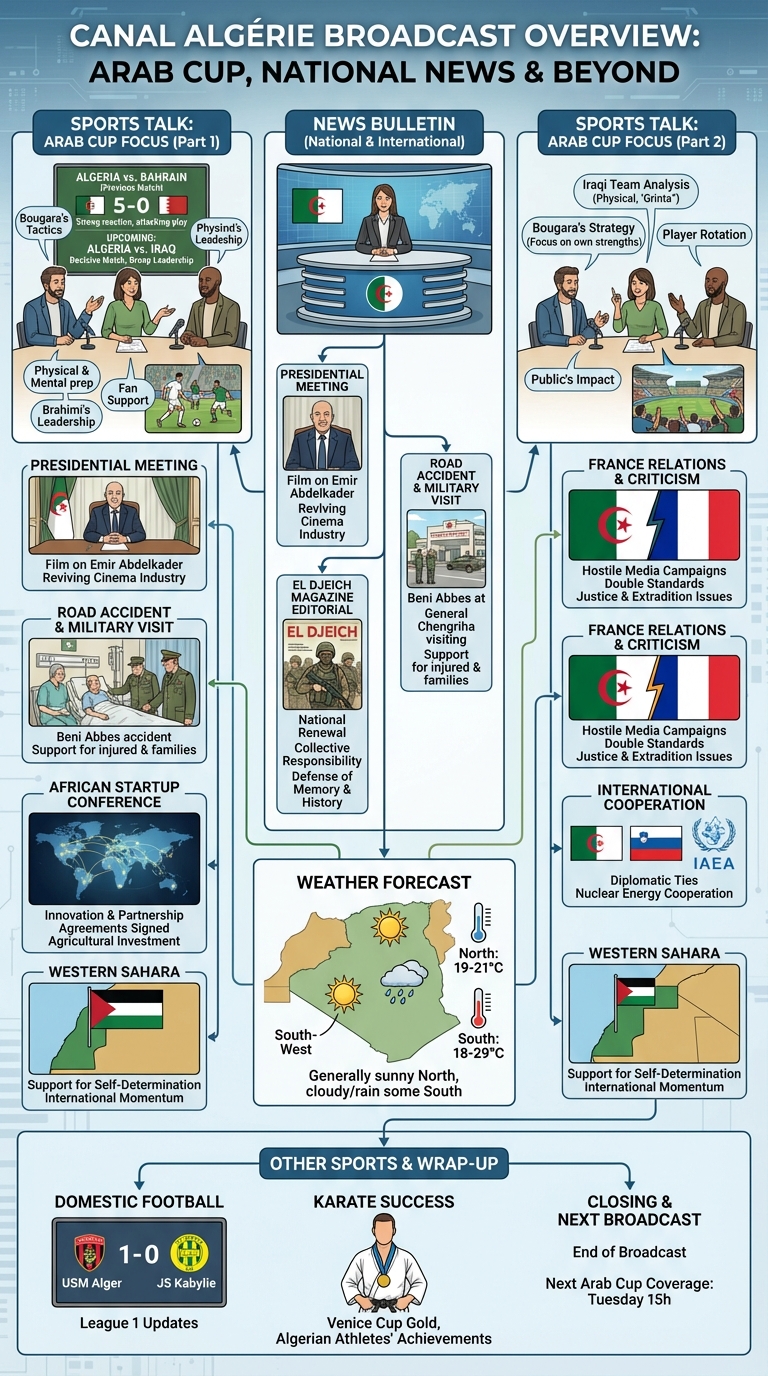
CANALALGERIE: December 8, 2025
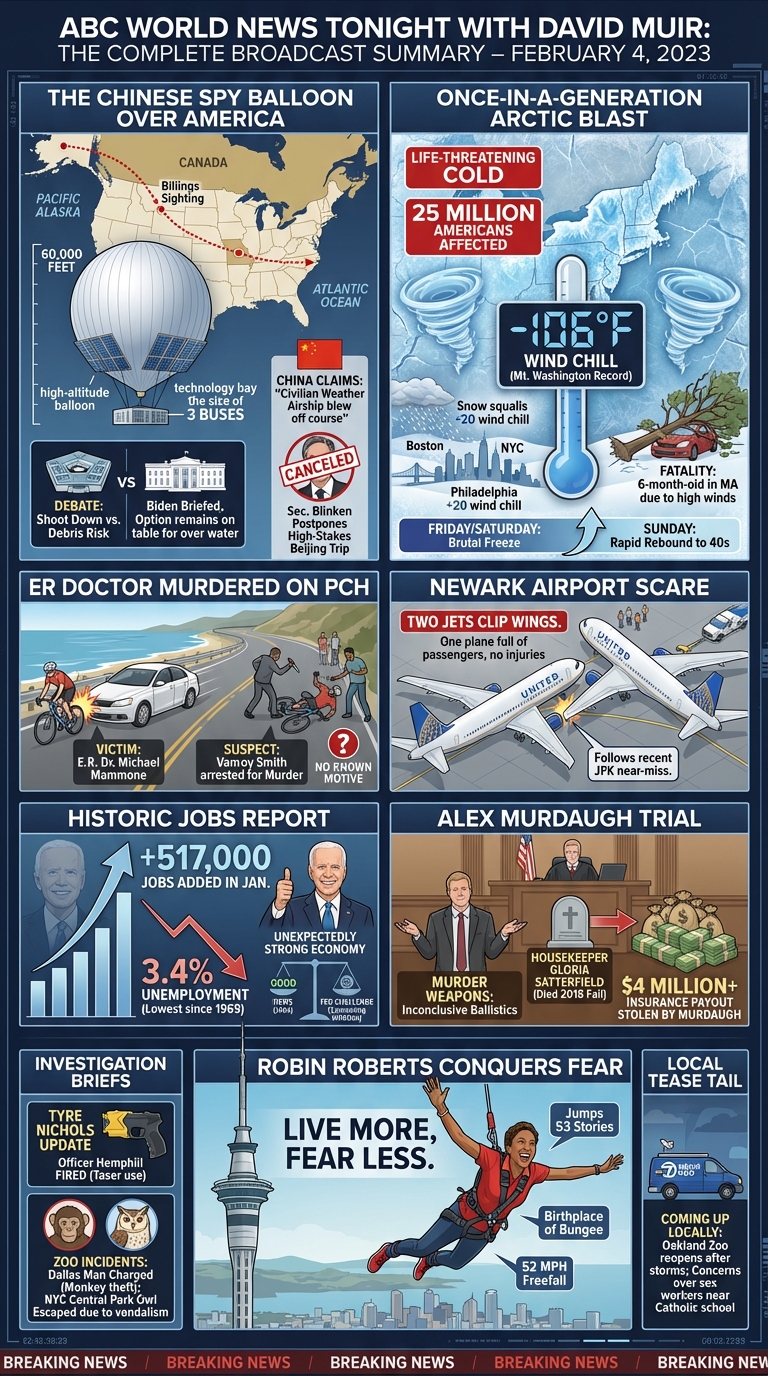
ABC World News Tonight With David Muir: February 3, 2023
You can compare with Vanderbilt University TV News Archive's human-generated story list for this broadcast.
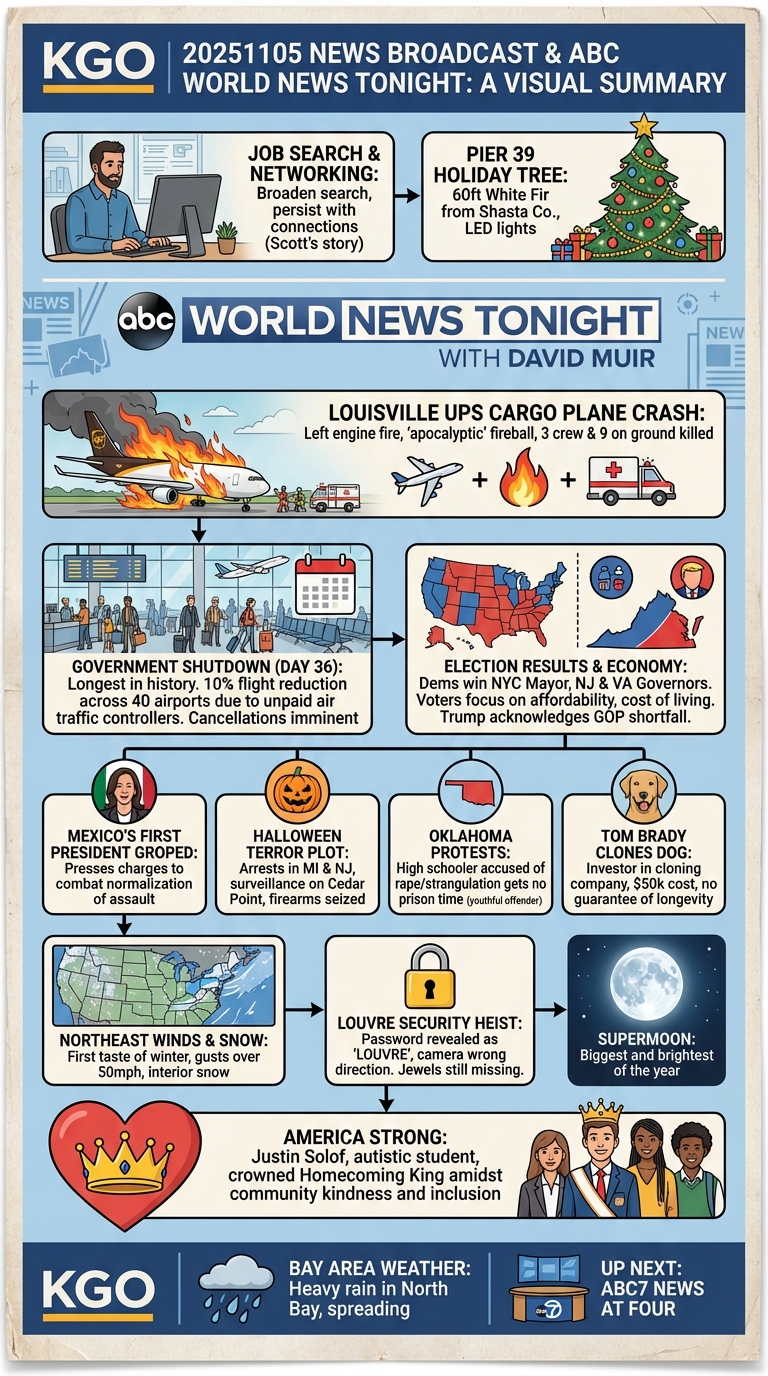
ABC World News Tonight With David Muir: November 5, 2025