
On Friday, we combined GDELT's Web NGrams 3.0 dataset with GCP's Timeseries Insights API, Translate API and BigQuery to create a realtime planetary-scale anomaly detection system for disease early warning and horizon scanning that scours global media for the intensity of discussion around any topic and flags anomalous changes in discussion, with the ability to fine-tune the system to precisely define the kind of anomaly of interest. Today we'll show how to use that same pipeline for financial early warning to detect anomalies in global news discussion around commodities, using the sunflower oil shortages of this spring as a case study.
Sunflower Oil
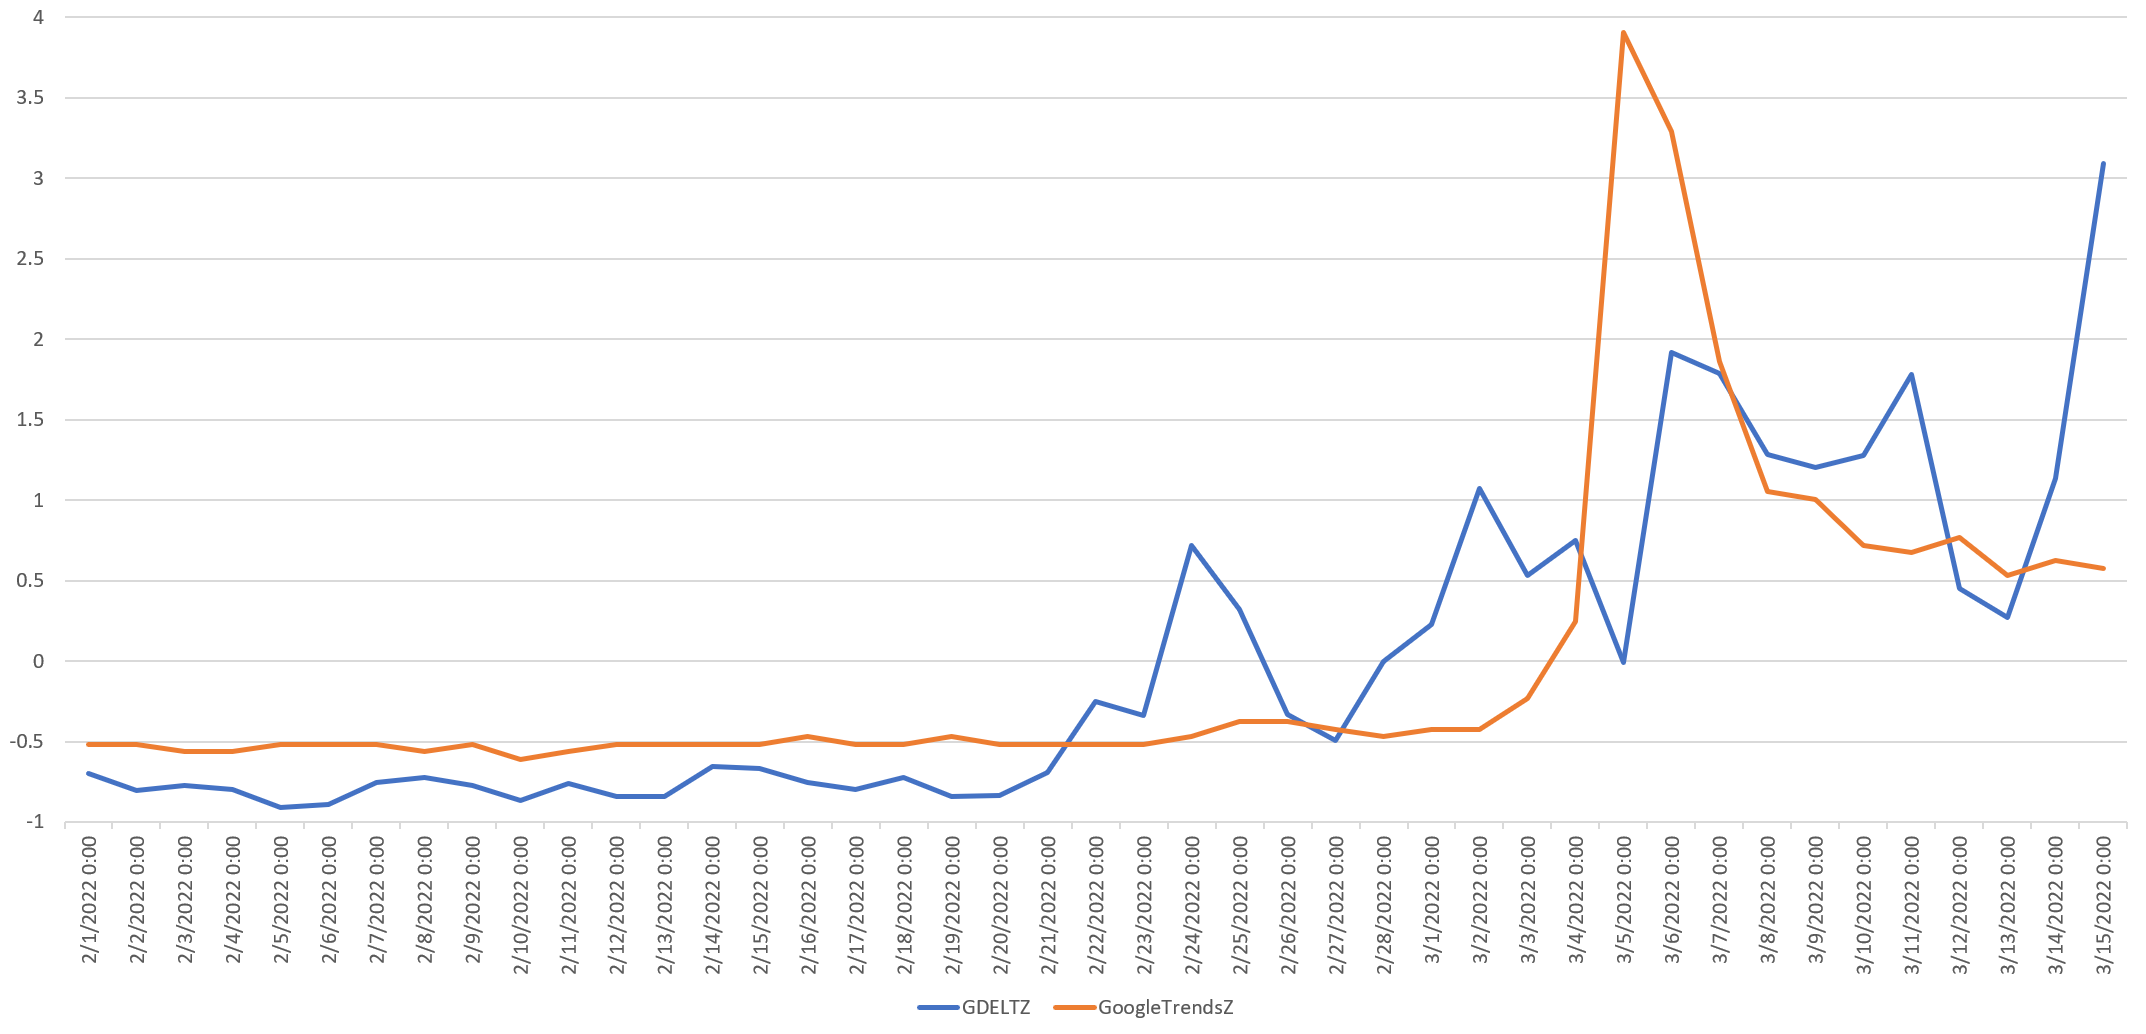
Russia's invasion of Ukraine sparked shortages and sharp price increases in a number of food commodities including sunflower oil, with supplies disappearing from store shelves earlier this year and some countries even implementing rationing. Yet these disruptions did not occur overnight. With Ukraine and Russia together accounting for 75% of global exports of sunflower oil, as the threat of invasion became more realistic in February, the press around the world increasingly digested what the war would mean for the commodity. Mentions began their ascent on February 22nd and increased in stages through the following month.
In contrast, worldwide Google web searches via Google Trends across the languages Google supports showed only a miniscule bump the day after the invasion on February 25th and did not exhibit a measurable surge in search interest until March 4th, peaking on March 5th.
The timeline below overlays the two, with global news coverage via GDELT in blue and Google Trends search interest in orange, using Z-scores (standard deviations from the mean) to overlay the two on the same Y axis. The graph vividly illustrates just how much advanced warning was provided by rising news coverage compared with search interest.
While search interest is typically cited as a critical early warning indicator that "beats the news," we have found in the past that other oft-cited "beat the news" signals like Twitter typically lag news signals when using GDELT's approach of monitoring local news in local languages around the world. Indeed, in the case of sunflower oil earlier this year, search trends did not sound the alarm on shortages and price surges until 10 days after news coverage began surging.
Financial Early Warning Using The Timeseries Insights API
How might we apply the same approach as Friday's global disease early warning system to the financial markets and detect anomalies in media attention to key commodities?
Using the same pipeline we used for monkeypox on Friday, we begin with the search term "sunflower oil" and use GCP's Translation AI API to translate it into all of the languages supported by Google Translate, then query GDELT's Web NGrams 3.0 dataset using BigQuery to construct a timeline of articles mentioning the term and input the resulting time series into the Timeseries Insights API for anomaly detection.
We used the exact same scripts as before, with the only difference being a single change to QUERY.sql. Recall that for monkeypox we built our timeline around the total number of actual mentions, counting multiple mentions in the same article individually, so we concatenated the ngram, post snippet and URL together to form the groupId:
FARM_FINGERPRINT( CONCAT(ngram, post, url) ) groupId
For monkeypox this worked due to the term's relative rarity outside of a disease context and offered a more sensitive bursting behavior. In contrast, sunflower oil appears in a wide range of news coverage daily, with some articles unrelated to shortages mentioning it heavily and others relevant to shortages mentioning it sparingly. Thus, to generate a more stable signal more attuned to overall attention, we form the groupId purely on the URL, constructing a timeline of article counts rather than mentions:
FARM_FINGERPRINT( url ) groupId
You can download the final files below:
The dataset file ("sunfloweroila.json") was loaded into the Timeseries API exactly the same as we did for monkeypox. Here we have appended "a" to the end of the filename to clarify that it uses article counts instead of total mentions.
For monkeypox we used a one hour rolling window for anomaly detection to detect the sudden onset surges in coverage that typically accompany the early glimmers of disease outbreaks. In contrast, while commodities can experience similar bursts, they typically come at the end of a longer more gradual increase in mentions that provide a longer runway for detection. To maximize our sensitivity to such longer buildups, we are going to use a 24-hour rolling window.
Thus, the following lines in the query script:
timeseriesParams: {
    forecastHistory: "259200s",
    granularity: "3600s"
},
Are changed to the following:
timeseriesParams: {
    forecastHistory: "1209600s",
    granularity: "86400s"
},
That is the only change, other than changing the start and end dates, step and dataset names at the top of the script:
$DATASET = 'sunfloweroila';
$STARTDATE = 20220201000000;
$ENDDATE =   20220315000000;
$STEP = 86400;
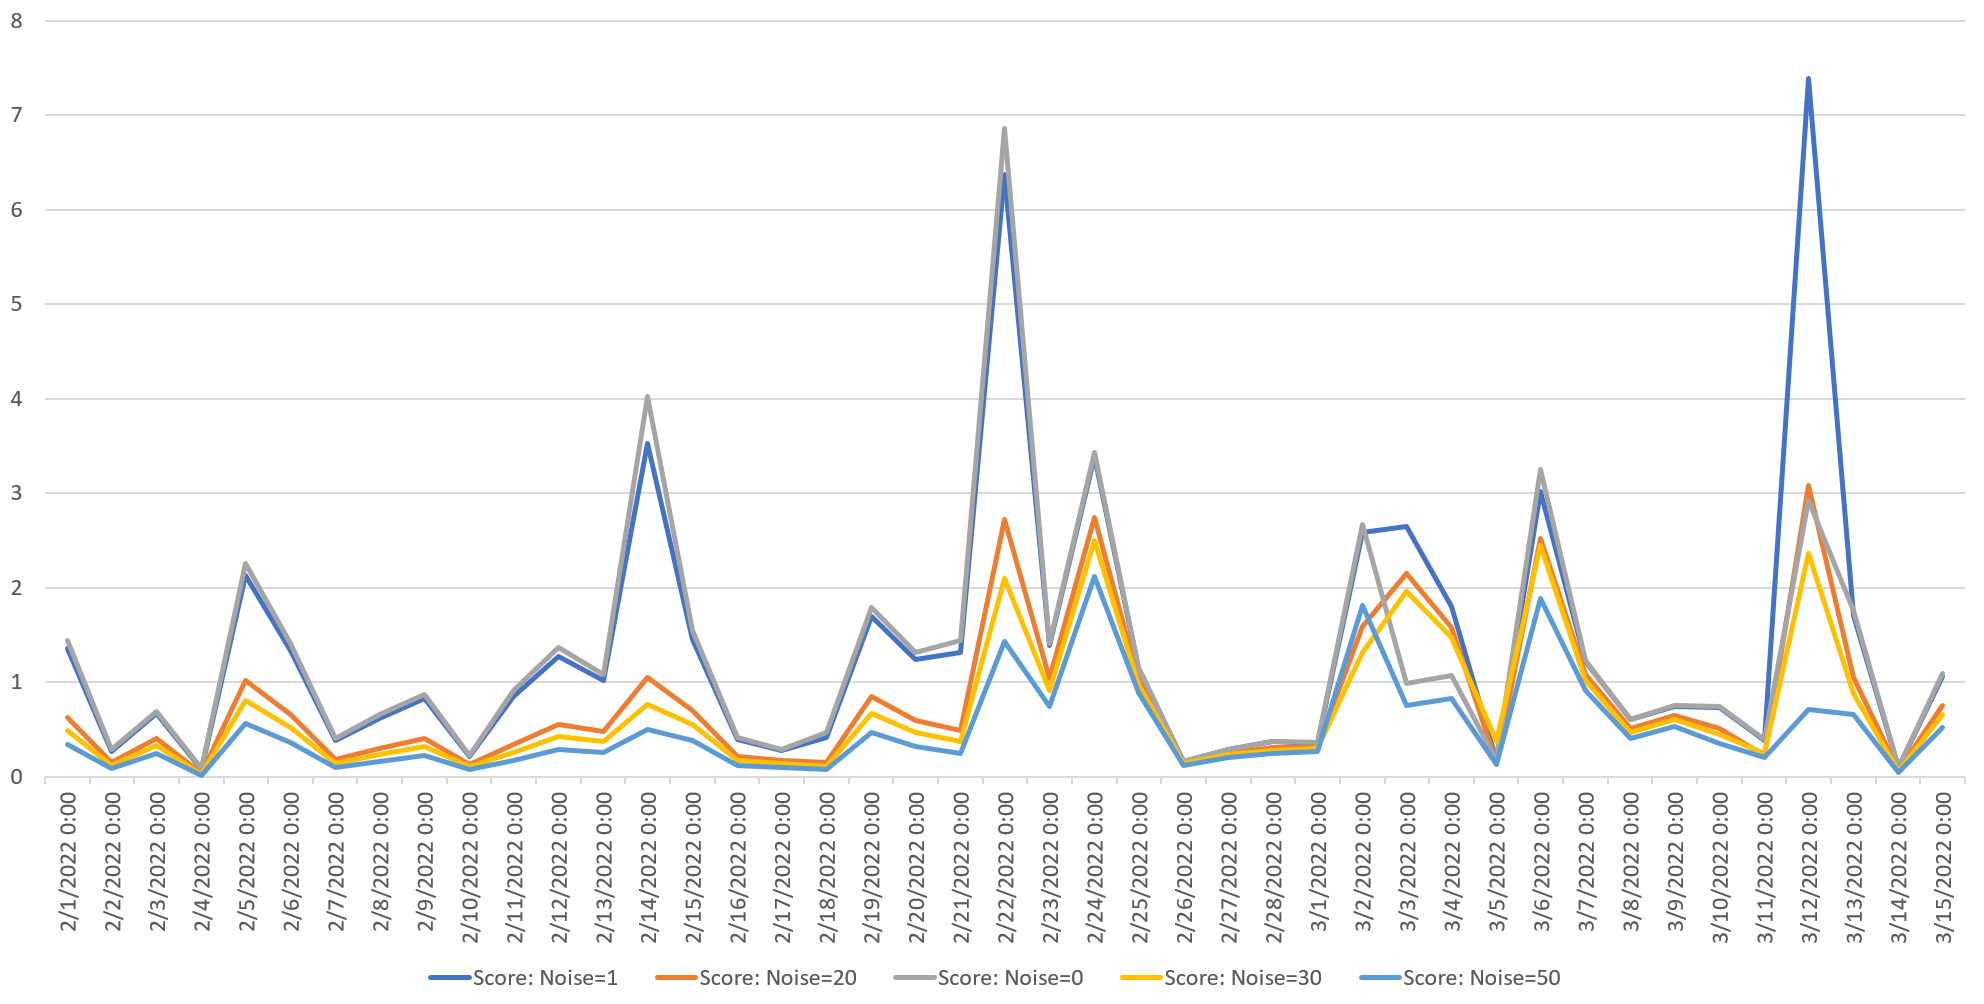
Some of you might wonder what the impact of the "noiseThreshold" parameter is. Here we run the API over our time series with five different values for noiseThreshold (0, 1, 20, 30 and 50) to show their different responsiveness. All five show relative similar trajectories, but differ in how strongly they respond to specific moments in the timeseries. In other words, by adjusting this value alongside the granularity and forecastHistory and adjusting the cutoff in your alerting code for the anomalyScore, you can construct anomaly detectors of varying sensitivity.
Using the same noiseThreshold of 1 we used for monkeypox and a 14-day rolling comparison window, the timeline below shows the final results of running the API across our analysis period of February 1, 2022 through March 15, 2022. The three timeseries are GDELT total articles mentioning sunflower oil (orange), Google Trends web searches for the topic of Sunflower Oil (grey) and the Timeseries Insights API's anomaly score (blue). All three are displayed as Z-scores to enable their relative movements to be compared on the same Y axis.
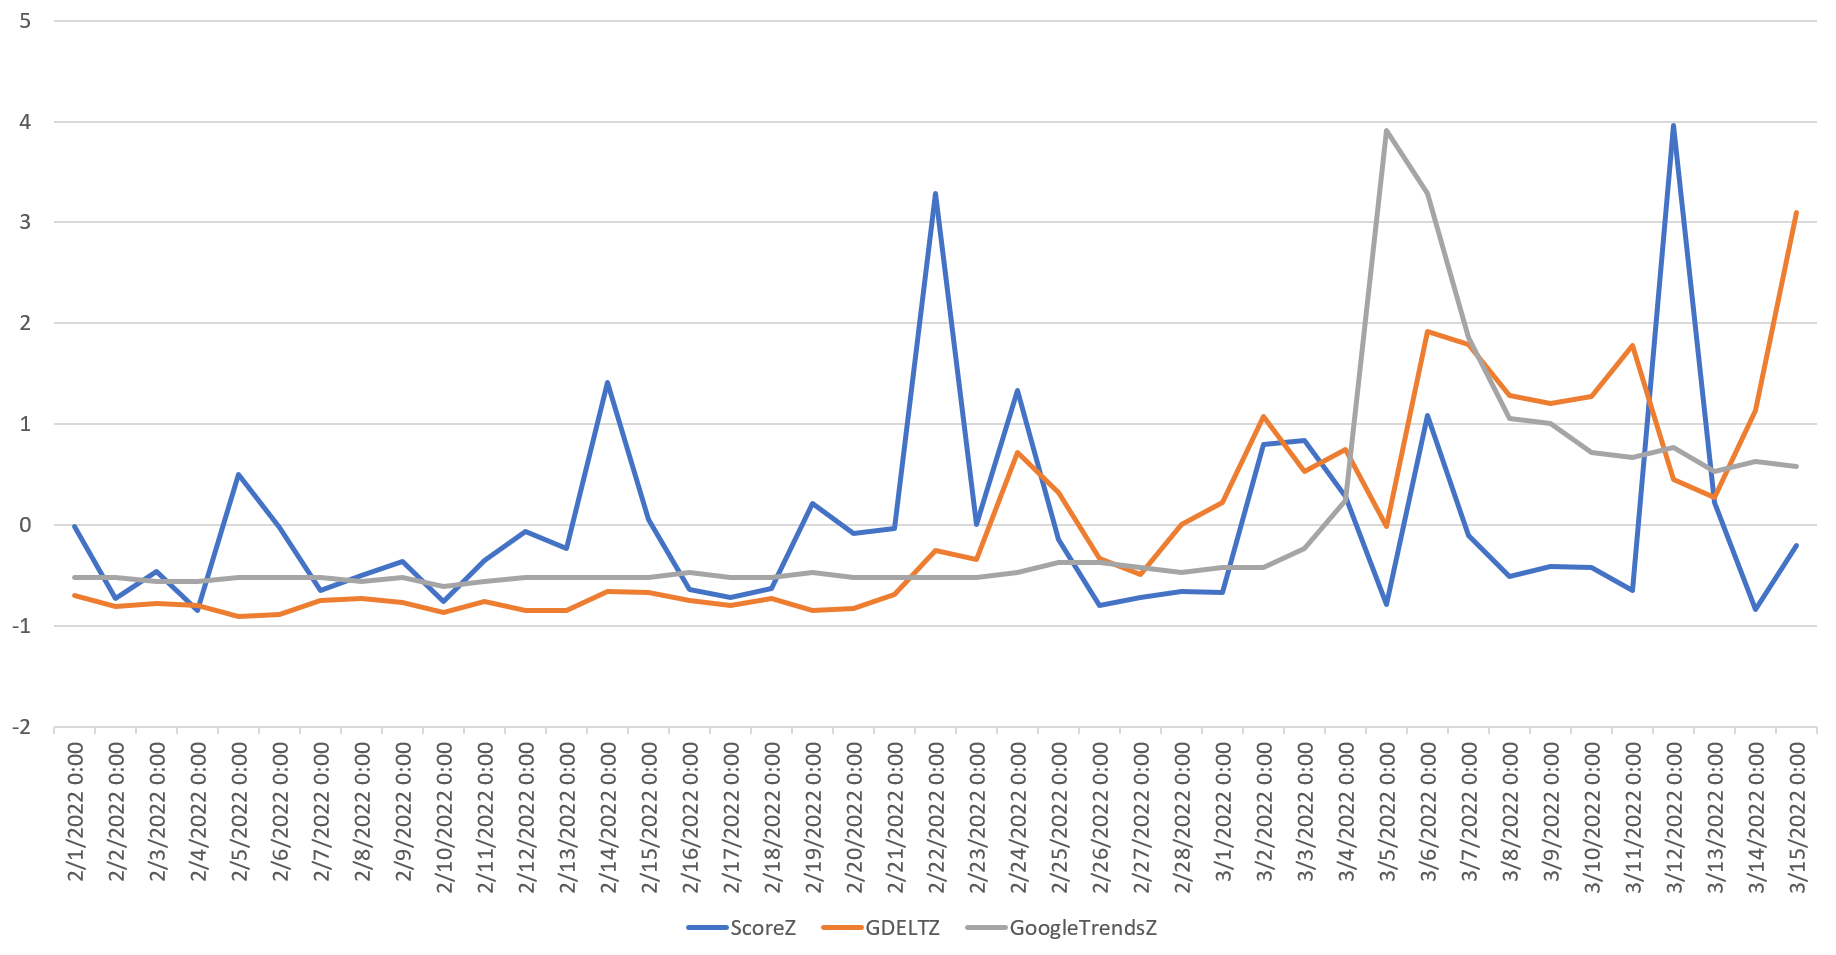
Most obvious is that the Timeseries API's analysis of GDELT news data shows an anomalyScore peak on February 22nd of 3.3, which places it in the "High" range. Recall that this is the day that worldwide media coverage of sunflower began its ascent, meaning the API picked up the very earliest glimmer of trouble despite using a 24-hour rolling window instead of a 1-hour window. Note that rather than "beating the news," web search interest does not produce a similar spike until March 5th, reinforcing the power of monitoring these slow onset news increases.
A second even stronger peak of 3.96 occurs on March 12th. At first glance this might seem puzzling, since coverage actually drops sharply on this day. This captures a really important aspect of the API's anomaly detection: it detects sharp decreases as well as increases. Any anomalous deviation in the timeseries, whether an increase OR decrease is detected. In this case, there is a sudden sharp vertical drop in mentions far more significant than in the preceding 14 days, leading the API to flag this as an anomaly.
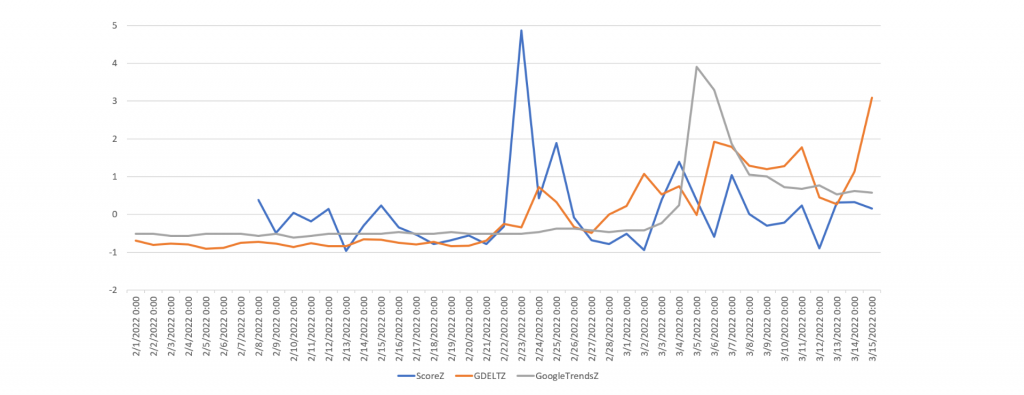
What if we want to focus more narrowly on the initial spike in coverage? Instead of comparing the given 24 hours to the previous 14 days, we add an extra week, comparing it to the preceding 21 days (changing "forecastHistory" to "1814400s"). This longer comparison period dampens a lot of the burstiness of the original timeline, since the API has a larger comparison timespan to search through. Since we only extracted data beginning on February 1, 2022, we've excluded the first 7 days of anomalyScores, since there is no comparison data (in a production application you would ensure that the extracted data precedes detectionTime – forecastHistory).
This time we get a far more muted anomaly timeseries, with a single major spike of 4.9 (right at the cusp of "Very High") on February 22nd, with a second peak of 1.9 (just short of "High") on February 24th at the first local peak in coverage. Subsequent peaks are more subdued as would be expected with this comparison horizon. An alerting service built using this configuration would send an alert at that earliest glimmer of sunflower oil coverage rising, even though it was a relatively modest increase and not send alerts during the subsequent cyclic changes in coverage volume.

Whether scanning the world for disease outbreaks or economic risk like pending commodity shortages, the combination of GDELT's Web NGrams 3.0 dataset and GCP's Timeseries Insights API, Translation AI API and BigQuery offers the ability to perform realtime planetary-scale horizon scanning!