The Internet Archive's TV News Archive has preserved television news coverage from more than 50 countries and territories over the past quarter-century. How has that collection shifted geographically over the years? Using our new digital twin, BigQuery and Bigtable, we can for the first time begin to answer these key questions around geographic collection priorities.
The TV News Archive records the geographic location each of its more than 100 monitored channels were collected from in the "Scanning Center" variable. While this technically records the location the channel was collected from, rather than the channel's origin location, it offers us a quick and easy rough look at the geography of the Archive's reach over time. For the purposes of the analyses here we will examine all monitored coverage, regardless of whether it was "news" and regardless of whether it was successfully monitored or had a technical fault, etc.
Over more than 8 million broadcasts totaling 5.65 million hours of global coverage, the charts below offer a small glimpse into the Archive's geography, though this is complicated by the Archive listing some international channels under their actual country of origin, while others are listed as US-based due to the location of the satellite downlink or monitoring point.
Let's first compile a list of every distinct value that has ever appeared in the "Scanning Center" field and the total number of broadcasts and total monitored airtime.
select metaScanCenter, COUNT(1) numShows, ROUND(sum(sec)) secAirtime from (
select JSON_EXTRACT_SCALAR(DOWN, '$.metaScanCenter') metaScanCenter,  CAST(JSON_EXTRACT_SCALAR(DOWN, '$.durSec') AS FLOAT64) sec FROM (
  SELECT
    rowkey,
    ( select array(select value from unnest(cell))[OFFSET(0)]  from unnest(cf.column) where name in ('DOWN') ) DOWN
  FROM `[PROJECTID].bigtableconnections.digtwin` where  CAST(substr(rowkey, 0, 8) as NUMERIC) > 20000000
 )
) group by metaScanCenter order by secAirtime desc
This yields the following table, spanning more than 8 million broadcasts totaling 20.36 billion seconds (339 million minutes / 5.65 million hours) of airtime. Strangely, the list contains just 41 locations, even as we know there are at least ten more countries represented in the Archive's collection. A closer examination of the Archive shows why: a number of international channels are cataloged at their monitoring point, like a satellite dish in Richmond, CA, while others are cataloged at the location of the channel itself. Thus, it is critical to recognize that the geographic findings here are merely an estimate.
| metaScanCenter | numShows | secAirtime |
| San Francisco, CA, USA | 3072274 | 8588267946 |
| Richmond, CA, USA | 3182793 | 7796953347 |
| 562679 | 1287651337 | |
| Annapolis, MD, USA | 171786 | 540041664 |
| Moscow, Russia | 213504 | 505529390 |
| London, UK | 108320 | 254559568 |
| Doha, Qatar | 98974 | 222402439 |
| Berlin, Germany | 145584 | 209307282 |
| Barcelona, Spain | 42737 | 204514276 |
| Taipei, Taiwan | 47564 | 87131013 |
| Beijing, China | 33984 | 78652929 |
| Bowie, MD, USA | 42531 | 78438078 |
| London, England | 35429 | 73986811 |
| Kiev, Ukraine | 40244 | 71427836 |
| Minsk, Belarus | 33120 | 63803099 |
| Tehran, Iran | 29925 | 56434594 |
| Hemel Hempstead UK | 23773 | 44068268 |
| Hemel Hempstead, England | 22708 | 40730512 |
| Pyongyang, North Korea | 20993 | 37019423 |
| Philadelphia, PA, USA | 34735 | 33840720 |
| Hemel Hempstead, England, UK | 17766 | 31568671 |
| Budapest, Hungary | 26521 | 25103515 |
| Jerusalem, Israel | 10211 | 20269626 |
| Mexico City, Mexico | 1065 | 4080035 |
| Savaneta, Aruba | 2251 | 3842869 |
| LOCATION | 108 | 289577 |
| 754 | ||
| Woodbridge, VA, USA | 174 | |
| New York, NY, USA | 383 | |
| Boston, MA, USA | 180 | |
| Sioux City, IA, USA | 59 | |
| Las Vegas, NV, USA | 200 | |
| Orlando, FL, USA | 44 | |
| Tampa, FL, USA | 796 | |
| Charlotte, NC, USA | 18 | |
| Cincinnati, OH, USA | 10 | |
| Colorado Springs, CO, USA | 12 | |
| Cedar Rapids, IA, USA | 199 | |
| Denver, CO, USA | 116 | |
| Raleigh, NC, USA | 355 | |
| Milwaukee, WI, USA | 73 | |
| Cleveland, OH, USA | 18 | |
| Tokyo, Japan | 14 |
Using a more complex SQL structure, let's construct a pivot table timeline of these results by day over the past quarter century:
DECLARE CITIES ARRAY;
SET CITIES = (
select ARRAY_AGG(DISTINCT REGEXP_REPLACE(  JSON_EXTRACT_SCALAR(DOWN, '$.metaScanCenter')  , r'[^A-Za-z]+', '_') IGNORE NULLS) metaScanCenter FROM (
  SELECT
    rowkey,
    ( select array(select value from unnest(cell))[OFFSET(0)]  from unnest(cf.column) where name in ('DOWN') ) DOWN
  FROM `[PROJECTID].bigtableconnections.digtwin` where  CAST(substr(rowkey, 0, 8) as NUMERIC) > 20000000
 )
);

CREATE TEMP TABLE TIMELINE AS (
  SELECT DATE, metaScanCenter, ROUND(sum(sec)) sec
from (
select FORMAT_DATE('%m/%d/%Y', PARSE_DATE('%Y%m%d', substr(rowkey, 0, 8) )) AS DATE,
  CAST(substr(rowkey, 0, 8) as NUMERIC) DATESQL,
  REGEXP_REPLACE(  JSON_EXTRACT_SCALAR(DOWN, '$.metaScanCenter')  , r'[^A-Za-z]+', '_') metaScanCenter,
  CAST(JSON_EXTRACT_SCALAR(DOWN, '$.durSec') AS FLOAT64) sec,
   FROM (
  SELECT
    rowkey,
    ( select array(select value from unnest(cell))[OFFSET(0)]  from unnest(cf.column) where name in ('DOWN') ) DOWN,
  FROM `[PROJECTID].bigtableconnections.digtwin` where  CAST(substr(rowkey, 0, 8) as NUMERIC) > 20000000
 )
) group by DATE,metaScanCenter order by MIN(DATESQL)
);

EXECUTE IMMEDIATE FORMAT("""
  SELECT * FROM TIMELINE
  PIVOT (SUM(sec) FOR metaScanCenter IN %s);
""", (SELECT CONCAT("(", STRING_AGG(DISTINCT CONCAT("'", metaScanCenter, "'"), ','), ")") FROM UNNEST(cities) AS metaScanCenter ))
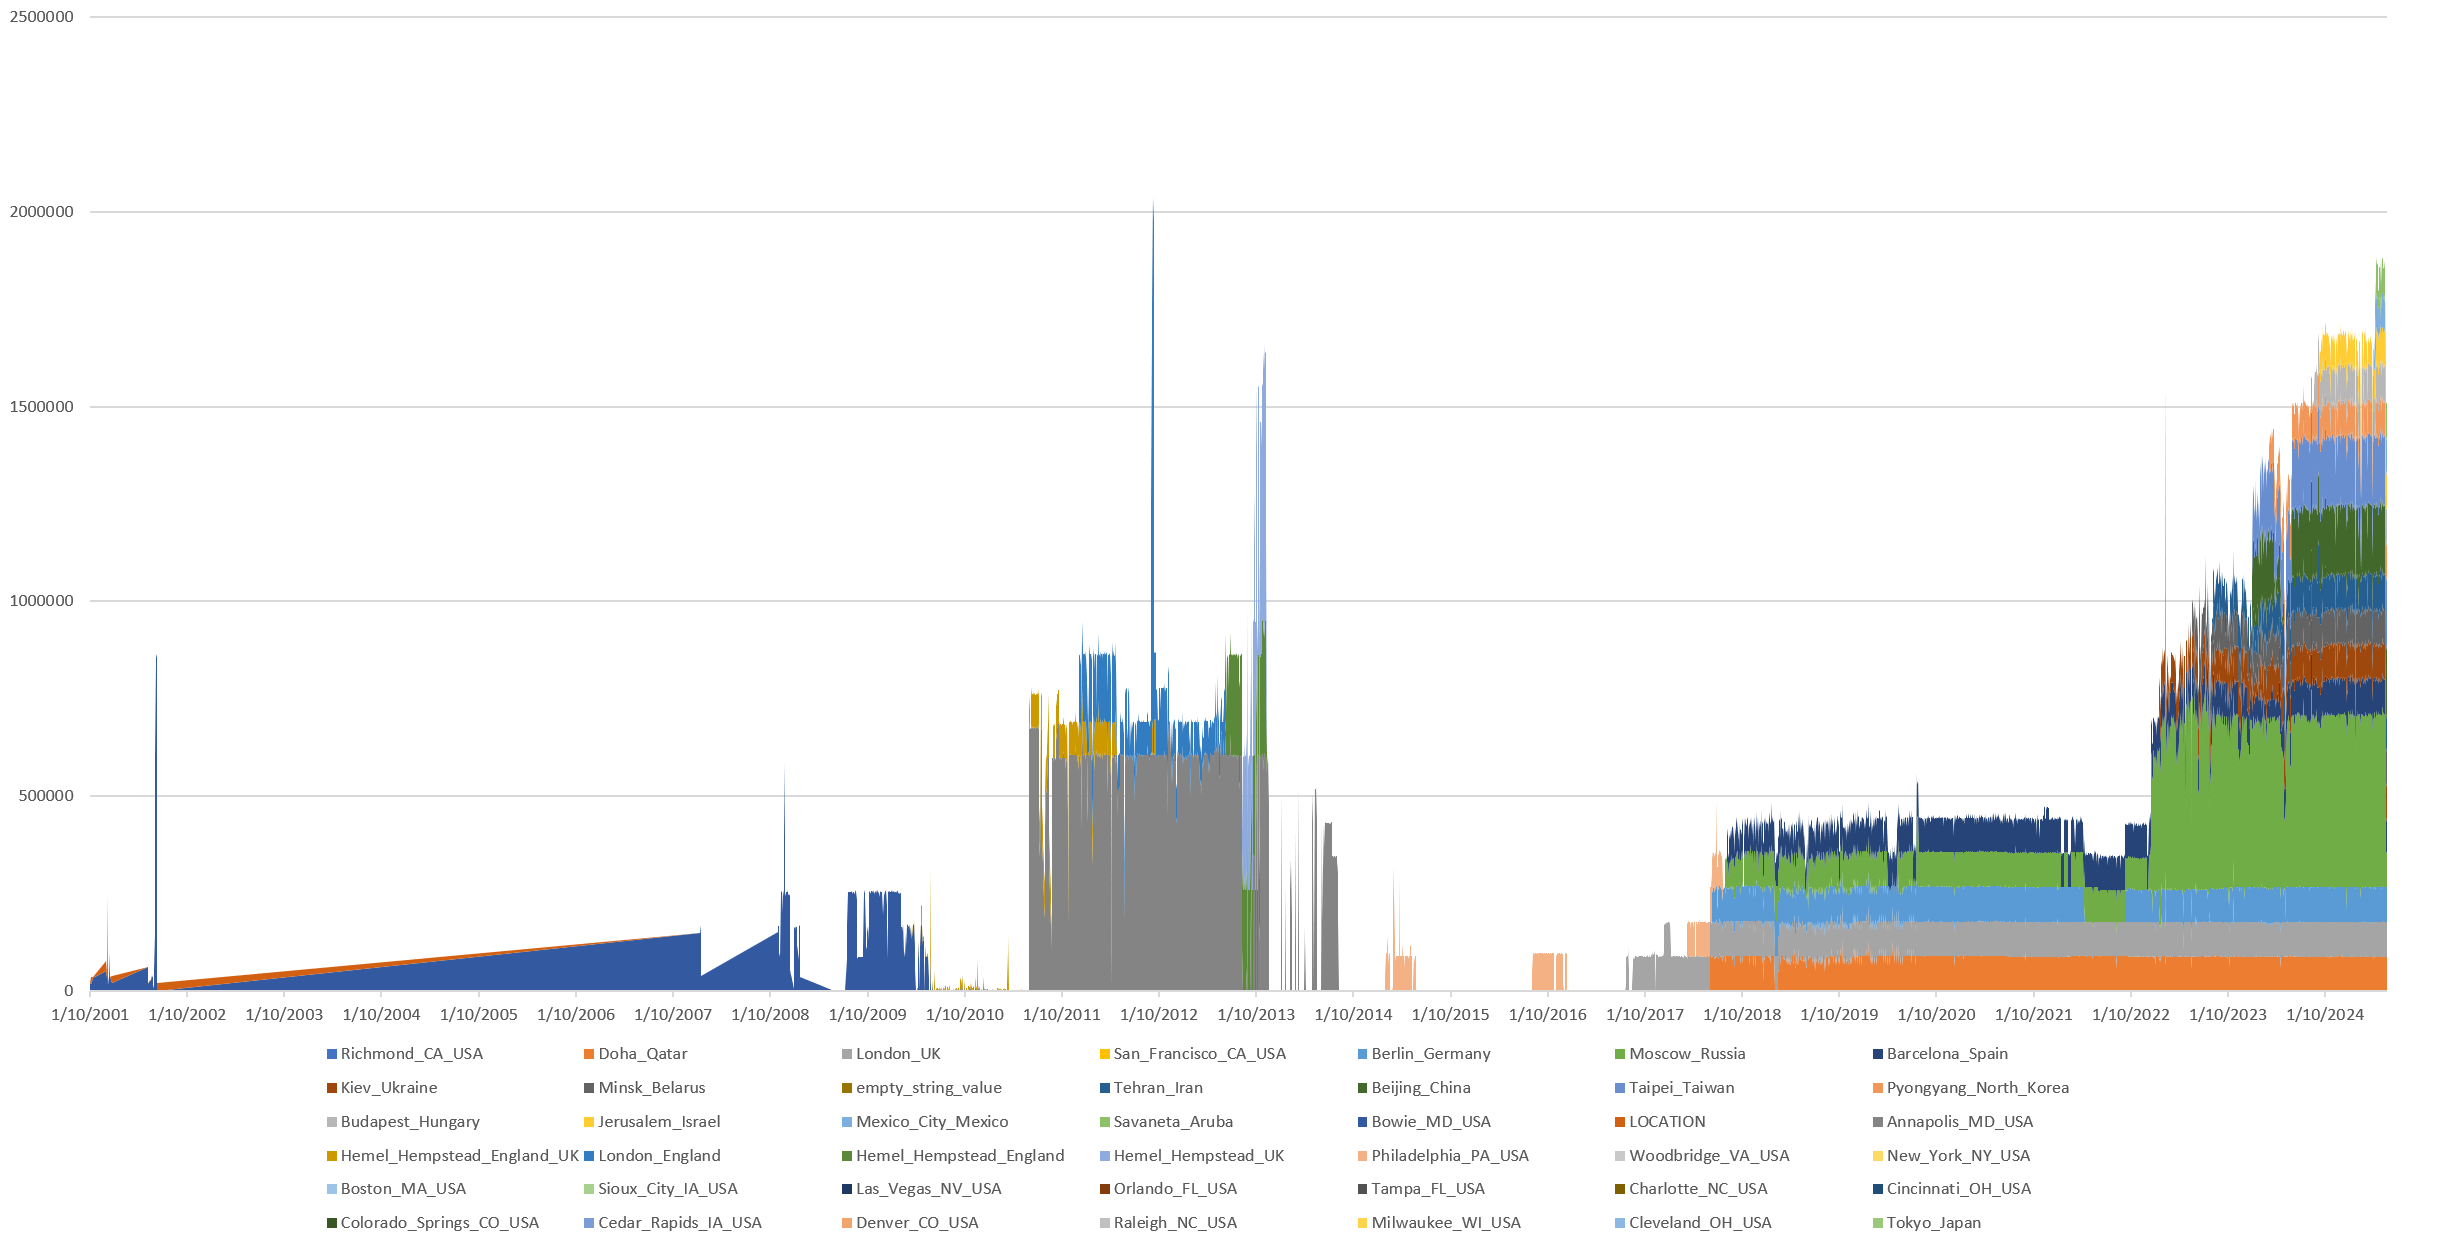
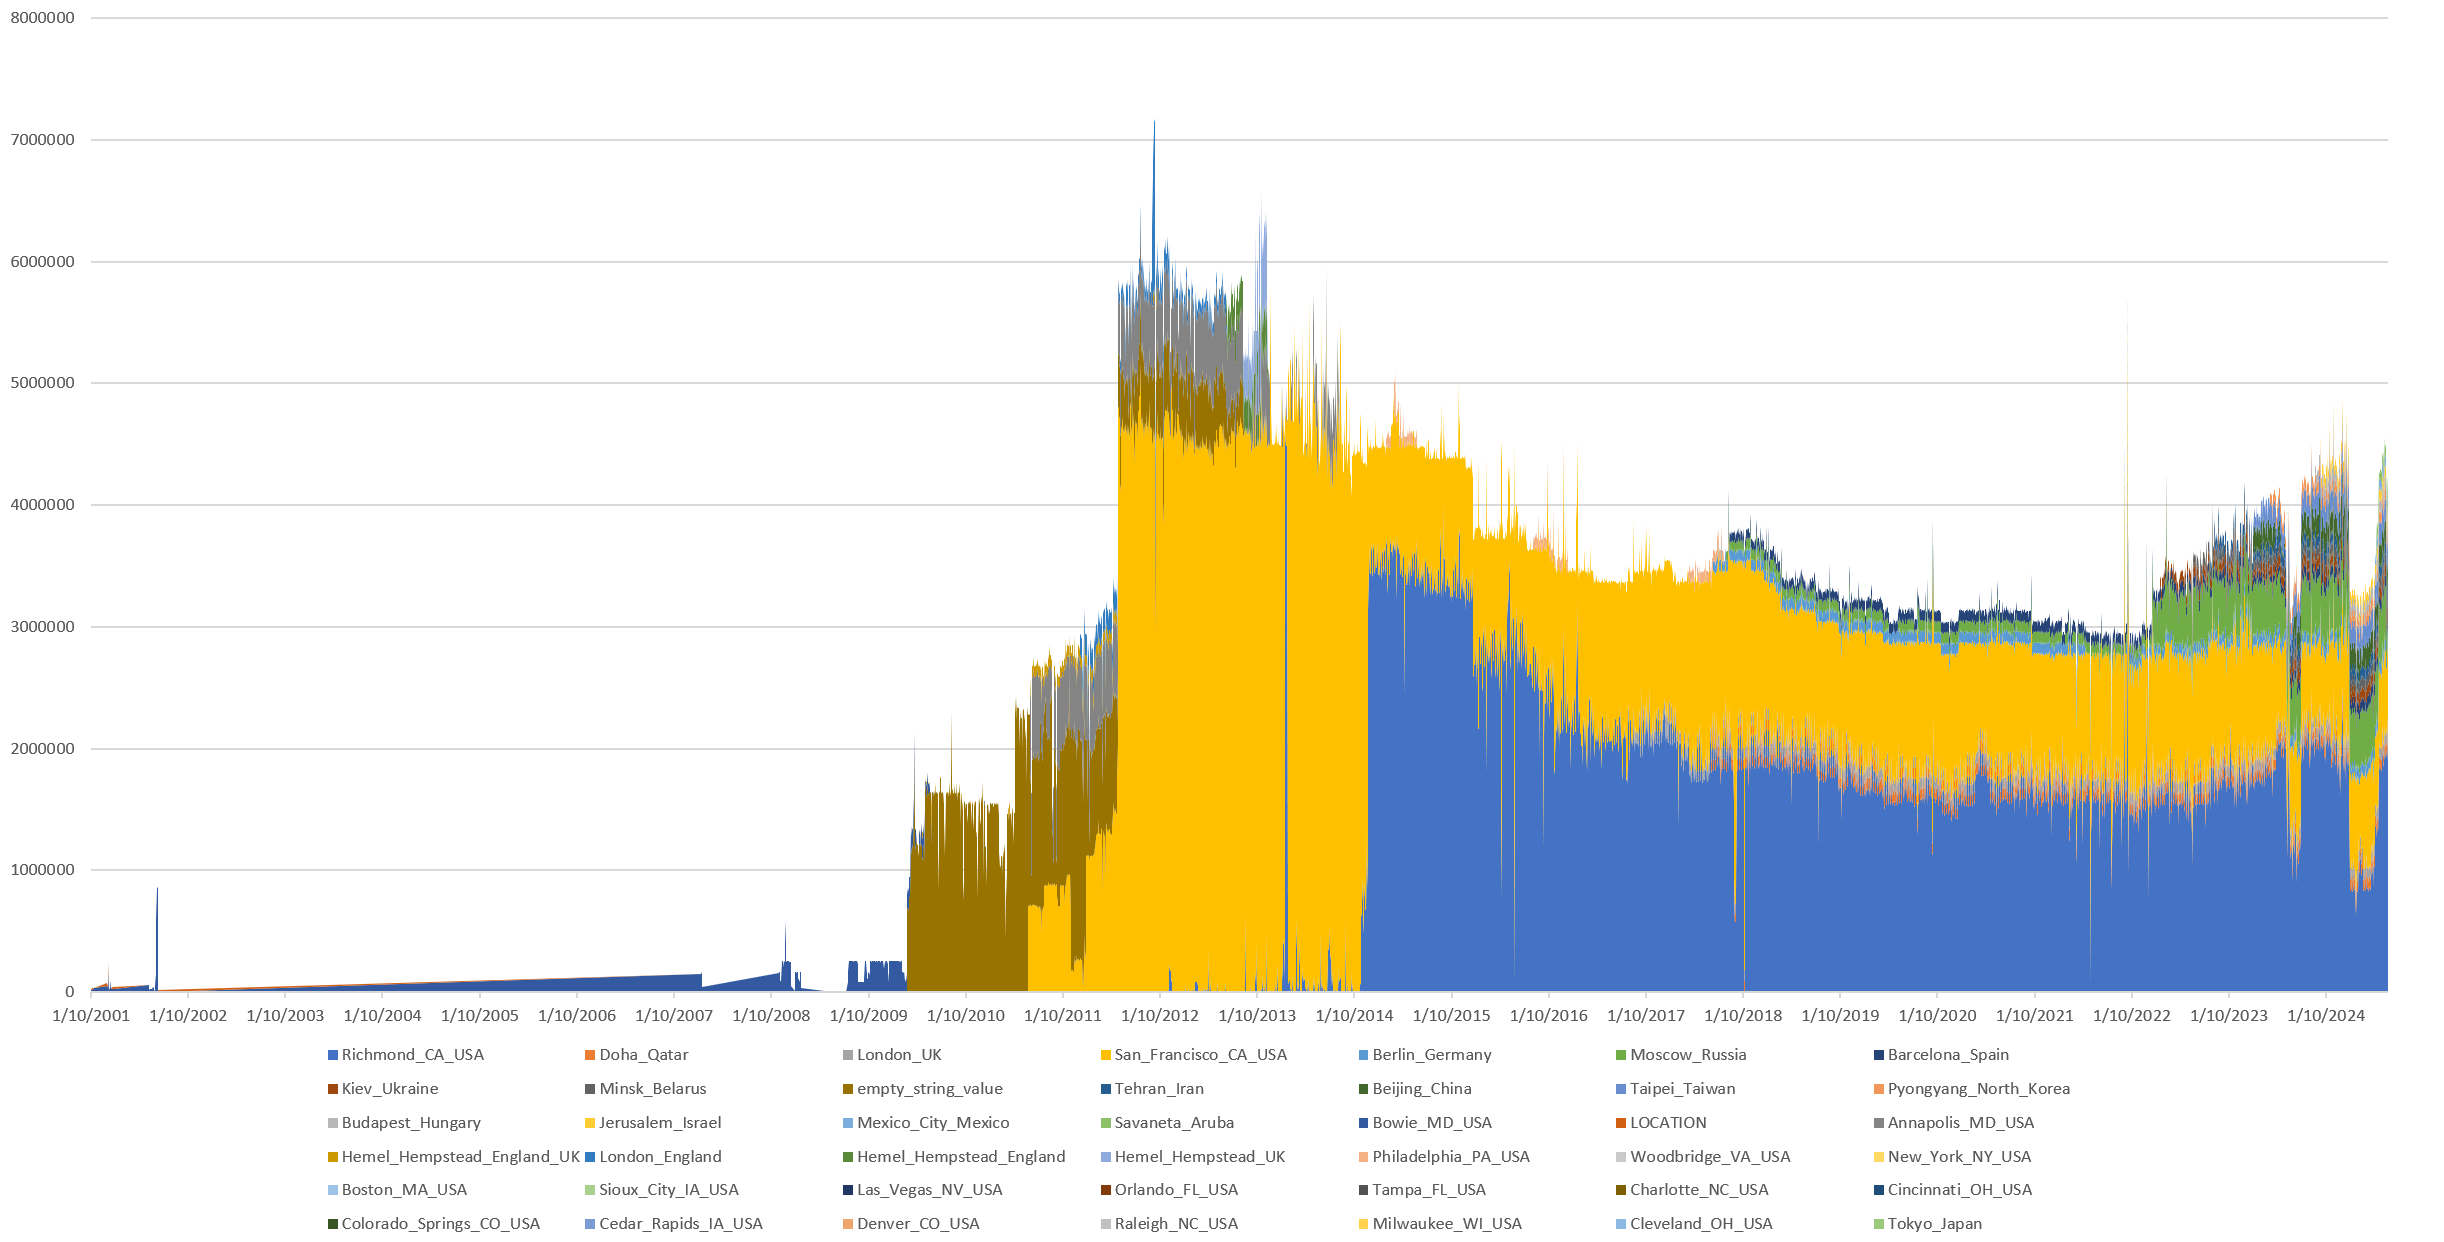
This yields the following timeline. For the Archive's first decade, Bowie, MD dominated as its collection center, before yielding to no specified location for the next several years, giving way to San Francisco in 2015 and then Richmond, CA in 2017. As noted above, many of the satellite channels are recorded as being ingested at the Archive's downlink location, such as Richmond, rather than the channel's source location.
If we remove the two main US scanning centers, we get the following. Remember that many of the satellite channels are listed under the US scanning centers, so this is not a complete list, but offers at least some insights into the geography of the Archive's collections in terms of collection.