Yesterday we unveiled our latest experiments in large-scale story cataloging to help journalists and researchers move from rote keyword searches towards understanding television news in terms of "stories" and "coverage," using Gemini 2.5 Flash Thinking to "watch" 1.4 million broadcasts by reading their more than 10 billion spoken words of captioning across 5 billion seconds (1.4M hours) of airtime to semantically cluster it into an annotated catalog of the stories reported on in all that coverage, allowing journalists and scholars to more readily identify stories of relevance to their research. Constructing a story catalog of more than 5 billion seconds of airtime ultimately cost just $42,900: well within the realm of what large libraries could afford to catalog their video archives. Given the immense interest in understanding and estimating token consumption for large LLM analyses, let's do a deep dive into the actual costs of running this analysis and what we can learn in particular about estimating thinking token consumption in large reasoning models during large real-world analyses.
As a reminder, we used the standard off-the-shelf public Gemini 2.5 Flash Thinking model for this analysis without any modifications. No data was used to train, tune or otherwise contribute to any model: we used Gemini only to create an index of each broadcast.
Token costs of modern LLMs are considerably cheaper for input than for output, but thinking adds a new wrinkle to these calculations. Those 10 billion spoken words (104 billion characters) cataloged in this analysis are primarily in English with a small amount of Spanish and yielded 38 billion input tokens. That works out to a ratio of around 2.7 input characters per input token for majority English content: a ratio which has held fairly consistently across all of our experiments to date and is a useful ratio for planning large LLM analyses involving English input material. Input tokens are charged at just $0.15 per million input tokens in batch mode for Gemini 2.5 Flash Thinking, with no price difference between large and small input documents (interactive inference charges differently based on whether the document is larger or smaller than 200K tokens). That means that it cost just $5,693 to have Gemini 2.5 Flash just examine all 5 billion seconds of airtime. Output is where things get more expensive, at $1.25 per million output tokens, working out to $17,322 in our case due our requirement to have all of the catalog entries output as JSON records with a complete index of each mention of each story.
Most interesting, however, is that the amount of thinking that Gemini 2.5 Flash Thinking had to perform in this case cost more tokens than the resulting catalog entries themselves, at $15,861. Modern LLMs "think" by reasoning things out internally, essentially narrating an internal textual monologue, much like a human being. While this monologue is not available for inspection other than in summary form, it is considered part of the model's "output" tokens and is charged at the same $1.25/million token rate.
At the same time, this "thinking" process is absolutely existential to our workflow. Continued testing since the release of Gemini 2.5 Flash shows extensive hallucination with thinking disabled, but with thinking enabled, measurable hallucination in the catalog entries drops to zero. Thus, thinking may be expensive, but it effectively eliminates hallucination in our cataloging workflow, making it essential, despite its higher cost.
This raises a fascinating question about how to plan for thinking budgets in large projects. Input costs can be effectively estimated using the 2.7 characters per token ratio above for English corpuses. Output costs can be estimated based on random spot checks of how many stories are typically covered in a given broadcast. But, how can we estimate thinking costs? Is there a similar ratio of input to thinking costs that we observe over this corpus?
Our data science analysis earlier this week examined this question, constructing a correlation matrix across the entire dataset, which can be seen below. We can see that tokensPrompt (input tokens) are perfectly correlated with input words and characters, as expected, and demonstrates that that 2.7 characters-per-token ratio is fairly consistent across the entire dataset. We can also see extremely high, but not perfect, correlation with broadcast duration, reflecting that different news broadcasts feature speakers who speak at different speeds, resulting in different numbers of spoken words per second. In contrast, output tokens (the story catalog) are substantially less correlated with input, at just r=0.67 (n=1.4M) with input characters. This makes it much more difficult to estimate the total cataloging cost based on input size alone and why representational spot checks are essential in estimating output token costs.
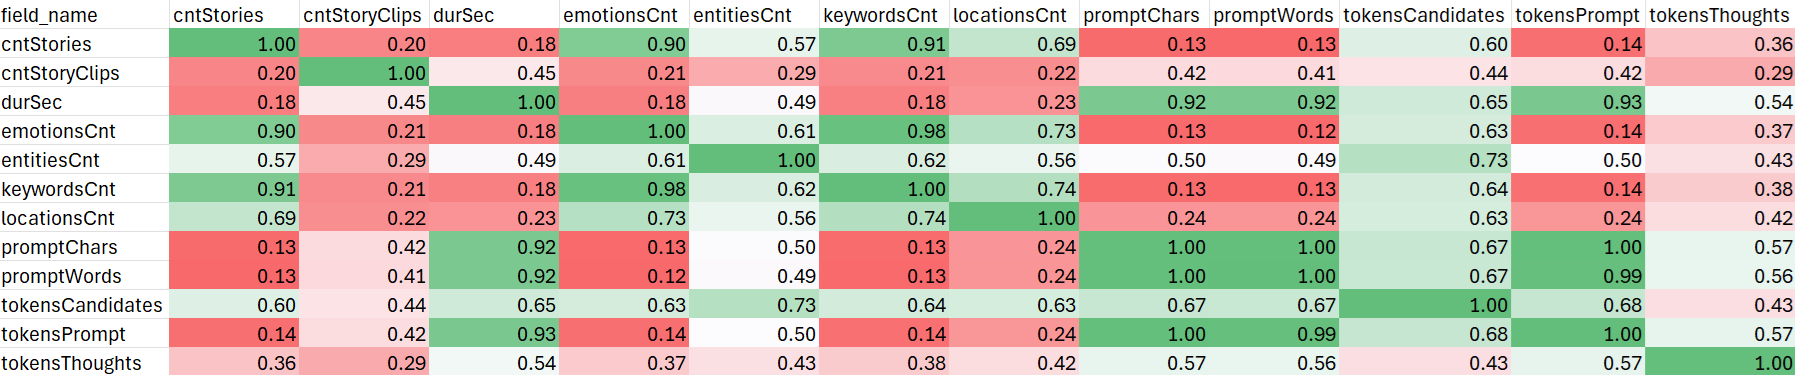
The least correlated with any variable is the number of thinking tokens. While there is a measurable and statistically significant correlation with input tokens, it is still only r=0.57 (n=1.4M), meaning thinking costs can be only very loosely estimated on corpus size alone. Intuitively, this makes complete sense, since thinking is only loosely impacted by input size: the far more important factor is the complexity of the task and input material. An hours-long broadcast that follows a simplistic linear structure and covers a single clear story likely requires far less reasoning by the model to cluster it than a 45-minute broadcast packing 15 complex interrelated stories that are interconnected and woven into various metastories.
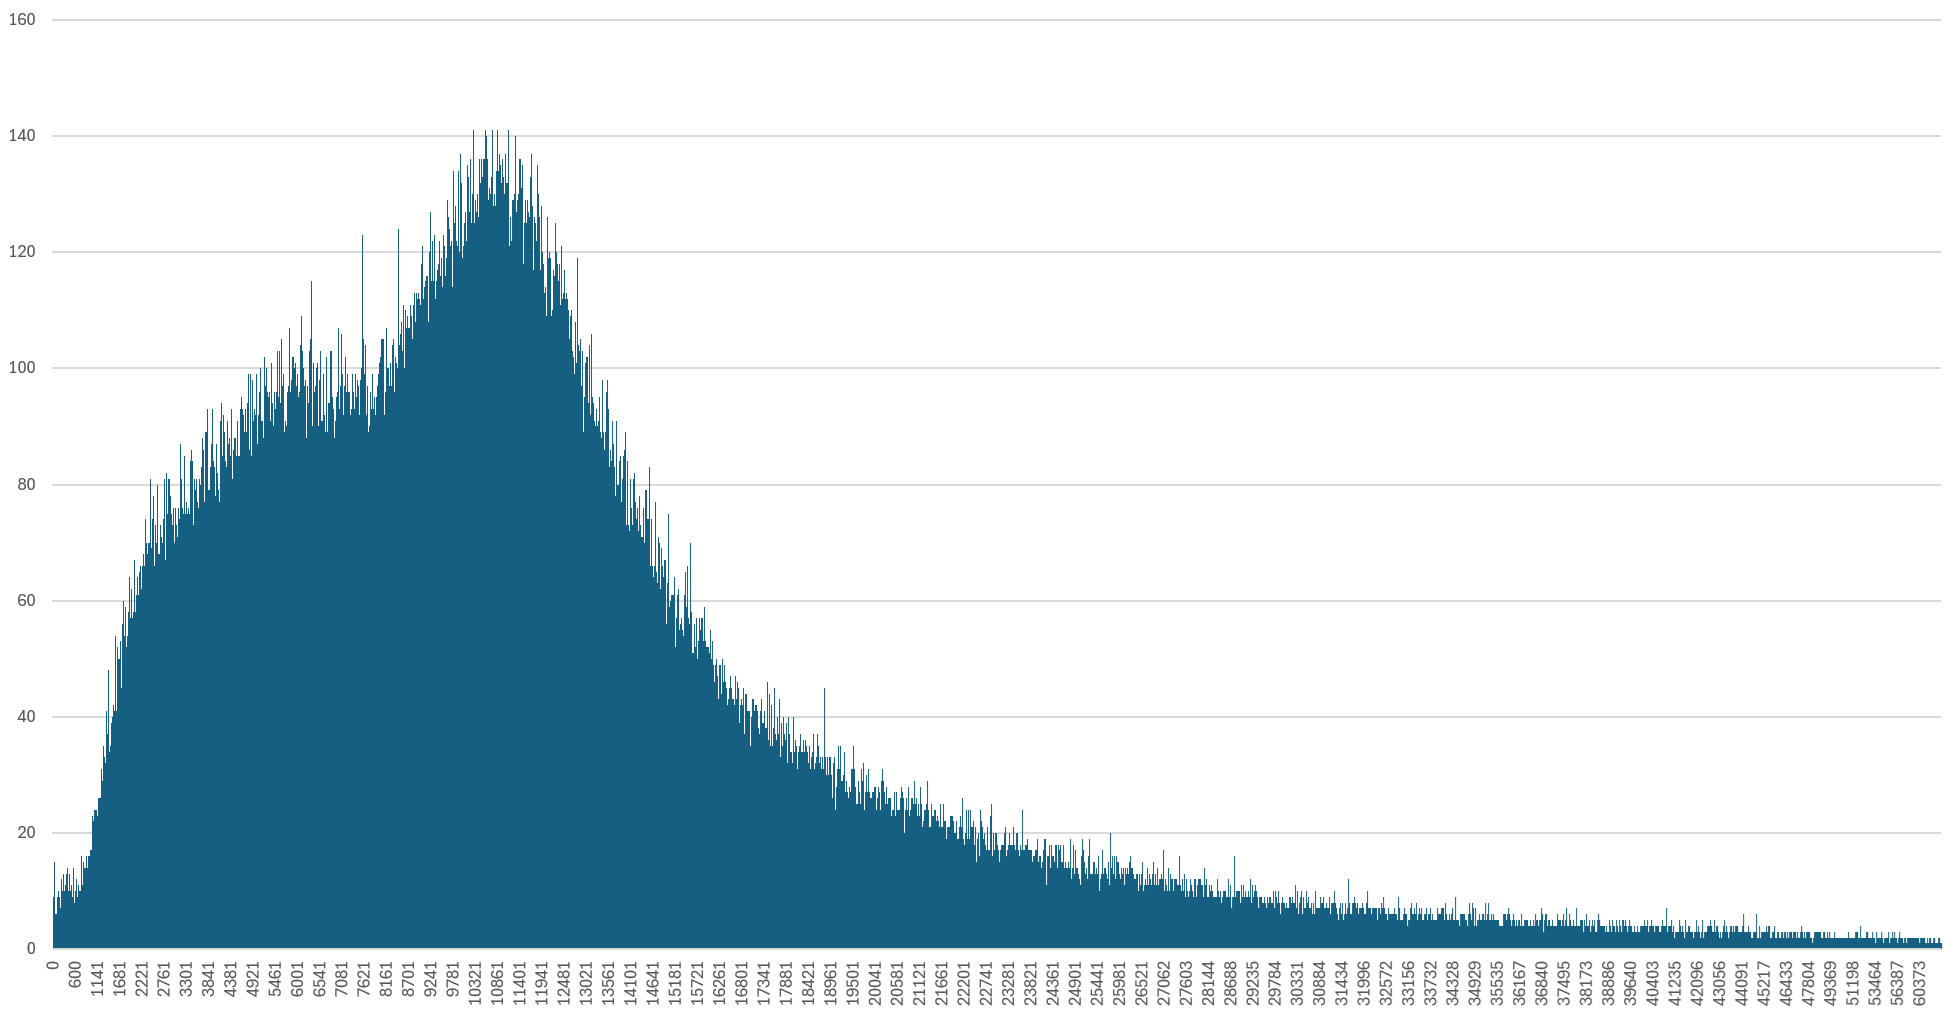
What does thinking look like in practice at these scales? Let's ask Gemini Cloud Assist to write us an SQL query giving us a histogram of the distribution of thinking tokens across the entire 1.4 million broadcast analysis. The barchart below plots thinking token size on the X axis and the number of broadcasts that consumed that many thinking tokens on the Y axis, ordered by thinking size along the X axis. We can instantly observe an interesting dual-peak structure in which most broadcasts consume at least 1500-2000 thinking tokens for our cataloging task, peaking at around 5000 tokens and a second peak at around 11K tokens, then a long tail up to Gemini 2.5's maximum 65K combined output+thinking token limit.
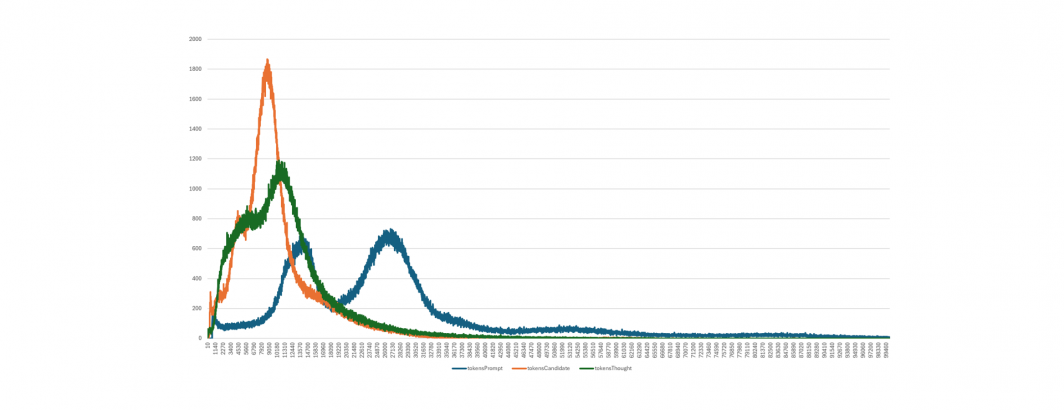
That dual-peak structure is fascinating and raises a fascinating question of why we see two such strongly defined peaks. Let's add input tokens and output (candidate) tokens to this same graph and expand out to 100K tokens (input tokens can be up to 1M, but the majority of the trends here are seen in the first 100K tokens). We also round the number of broadcasts with each token length to the nearest ten along the Y axis to make it easier to align the three token counts.
Here we immediately see the dual-peak structure occurs in all three token types and is most obvious in input tokens (blue). In fact, input tokens show two nearly identical peaks, at around 14K and 28K tokens. This reflects that the majority of television news broadcasts tend to be either 30 minutes or one hour, with a long tail of other durations. We see two peaks in the candidate/output token (orange) series: one small at around 3500 tokens and the primary peak at around 8K tokens. This reflects that the majority of broadcasts typically yield a similar number of stories (9.2 stories per broadcast on average across all 1.4M broadcasts), regardless of duration. This reflects that a 30 minute broadcast often covers a similar number of stories as a longer broadcast, just in a more condensed format.
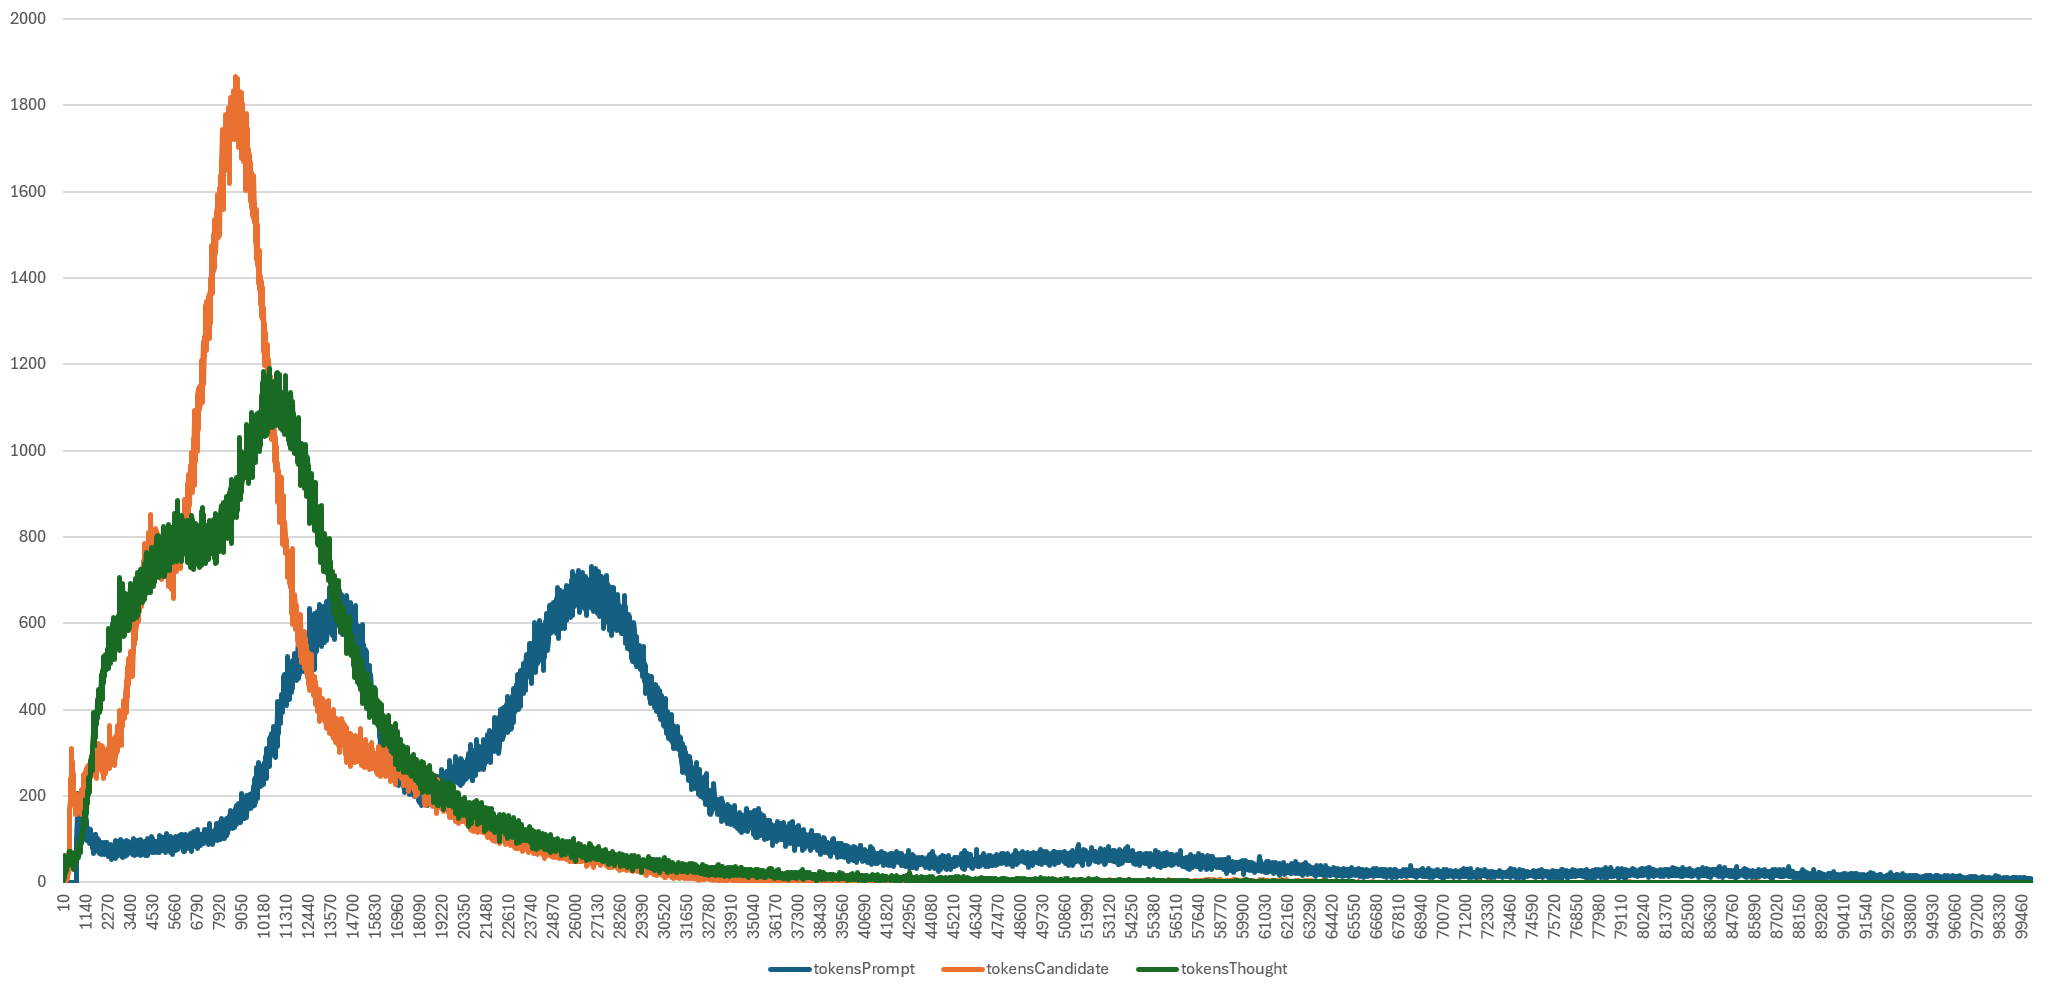
Thinking tokens present a similar pattern to output tokens, though with a less pronounced second peak. We can see that it does not significantly match the input or output token graphs, reflecting the difficulty in estimating thinking costs precisely. Given that thinking tokens come out of the combined output+thinking budget that maxes at 65,000 tokens, we can always estimate an upper bound worst case on thinking costs, but estimating with more precision is difficult. In practice, as the graphs above demonstrate, we typically find that thinking token consumption is typically less than 25% higher than output token consumption for our specific cataloging task and it is likely that carefully constructed representational random sampling at the onset of a large-scale project can help estimate both output and thinking token costs within reasonable boundaries.
At the end of the day, enabling thinking in Gemini 2.5 Flash has effectively eliminated hallucination in our specific cataloging task, making it absolutely essential, even as estimating its token consumption in any given project can be difficult, though the graphs above offer insights into how to estimate the likely rough bounds of this consumption for a given project.