UPDATE: A new version of this analysis is available.
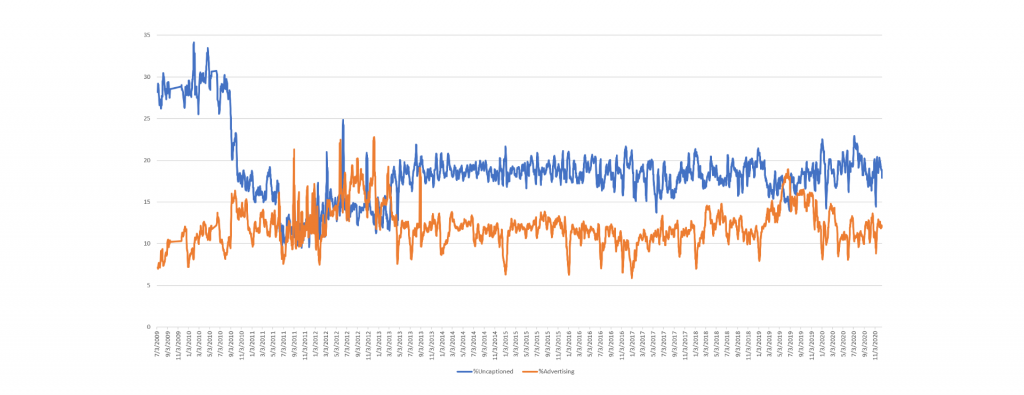
Earlier today we offered a first glimpse at some of the trends found in our massive new Television News Advertising Inventory Files (AIF) Captioning Time dataset. One of the questions raised by those initial graphs is what explained the huge surges in advertising+uncaptioned airtime in the 2009-2011 period. Since around 2014, uncaptioned airtime can typically be considered a commercial break, but it appears that in the earlier 2009-2013 period this may not always have been the case as you can see in the timelines below.
In fact, a deep dive into this data suggests this earlier period is due to an elevated number of broadcasts with partial captioning due to technical errors.
CNN
MSNBC
Fox News
The surge in 2012-2013 appears due to the East/West Coast monitoring overlap and we are working to enforce the cutoff period correctly here.
TECHNICAL DETAILS
Creating the timelines above was done with this SQL query on a temporary version of the dataset loaded into a temporary BigQuery table:
SELECT DAY, SUM(UNCAPSEC) UNCAPSEC, SUM(ADSEC) ADSEC, SUM(TOTSEC) TOTSEC, SUM(UNCAPSEC)/SUM(TOTSEC)*100 PERC_UNCAPTIME, SUM(ADSEC)/SUM(TOTSEC)*100 PERC_ADTIME FROM (
SELECT DATE(date) DAY, count(1) UNCAPSEC, 0 ADSEC, 0 TOTSEC FROM `[TEMPTABLE]` where station='FOXNEWS' and (type='UNCAPTIONED') AND DATE(date) >= "2009-07-02" group by DAY
UNION ALL
SELECT DATE(date) DAY, 0 UNCAPSEC, count(1) ADSEC, 0 TOTSEC FROM `[TEMPTABLE]` where station='FOXNEWS' and (type='ADVERTISEMENT') AND DATE(date) >= "2009-07-02" group by DAY
UNION ALL
SELECT DATE(date) DAY, 0 ADSEC, 0 ADSEC, count(1) TOTSEC FROM `[TEMPTABLE]` where station='FOXNEWS' AND DATE(date) >= "2009-07-02" group by DAY
) group by DAY having TOTSEC>=64800 order by DAY ASC
We continue to dive into this enormously powerful new dataset!
