Since August 2017, the Internet Archive's Television News Archive has extracted the chyrons of CNN, MSNBC, Fox News and BBC News by OCR'ing a small bounding box at the bottom of the screen every 1 second. Last month we began reprocessing the raw OCR data from the Archive into a new research chyron dataset. Taking the raw per-second as-is OCR output from the Archive, we clean and reshape it into a new research-grade dataset using language modeling and edit distance clustering to yield a maximally comprehensive chyron dataset that surfaces the "best" available onscreen chyron text for each minute.
To date these chyrons have primarily been manually examined by journalists looking to compare the coverage of major events across the four stations. Typically the side-by-side comparison viewer is used to view the chyrons minute by minute and flag periods of particular difference. Sometimes the chyrons can sharply diverge, such as in the early hours of March 7, 2019, when CNN and MSNBC focused on Michael Cohen's testimony, BBC News did a roundup of global news and Fox News focused on the Congressional debate over recent anti-Semitic remarks by one of its members. Other times they can be in lock step, such as the Trump-Trudeau meeting at the NATO summit on December 3, 2019.
Yet, the real power of such data comes from the ability to analyze it at scale, to surface the macro-scale patterns invisible to traditional human analysis.
Enter BigQuery.
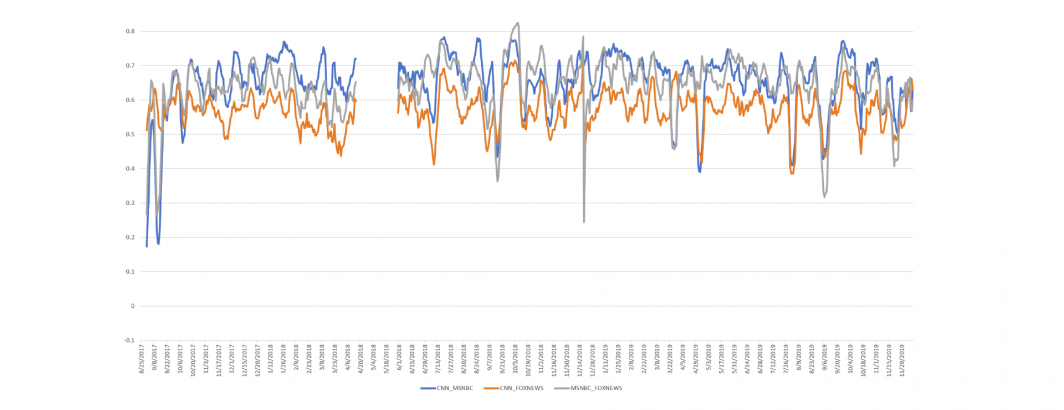
One natural macro-scale question that arises from this dataset is how similar the chyron text is across the four stations, whether particular pairs of stations are more similar than the others and most importantly, whether they are becoming more or less similar over time.
Answering this question requires first concatenating the per-minute chyron text for each station for each day. This station-day blob must then be split into individual words and converted to a daily per-station word histogram. The four sets of per-station word histograms must then be aligned and merged and used to compute a Pearson correlation assessing their similarity. This process must be repeated for each day of the two and a half year timeframe.
Ordinarily this would require a fair bit of scripting and data management, typically with multiple passes through the data to maximize data parallelism and aggregation.
Instead, through the power of BigQuery, this entire pipeline can be executed through a single SQL statement. That's right, a single SQL query collapses the station-minute chyron text into station-day aggregates, splits them into words, compiles those words into unigram tables, aligns and merges those tables by day and computes the cross-correlations for each day, iterating by day over the entire two and a half years.
It turns out that the results of this analysis instantly surface days with contested news narratives.
Learn more about these findings.
In the end, the ability of BigQuery to execute such complex analytic workflows within a single SQL query reminds us of its enormous potential for linguistic analysis at the scale of news itself.