
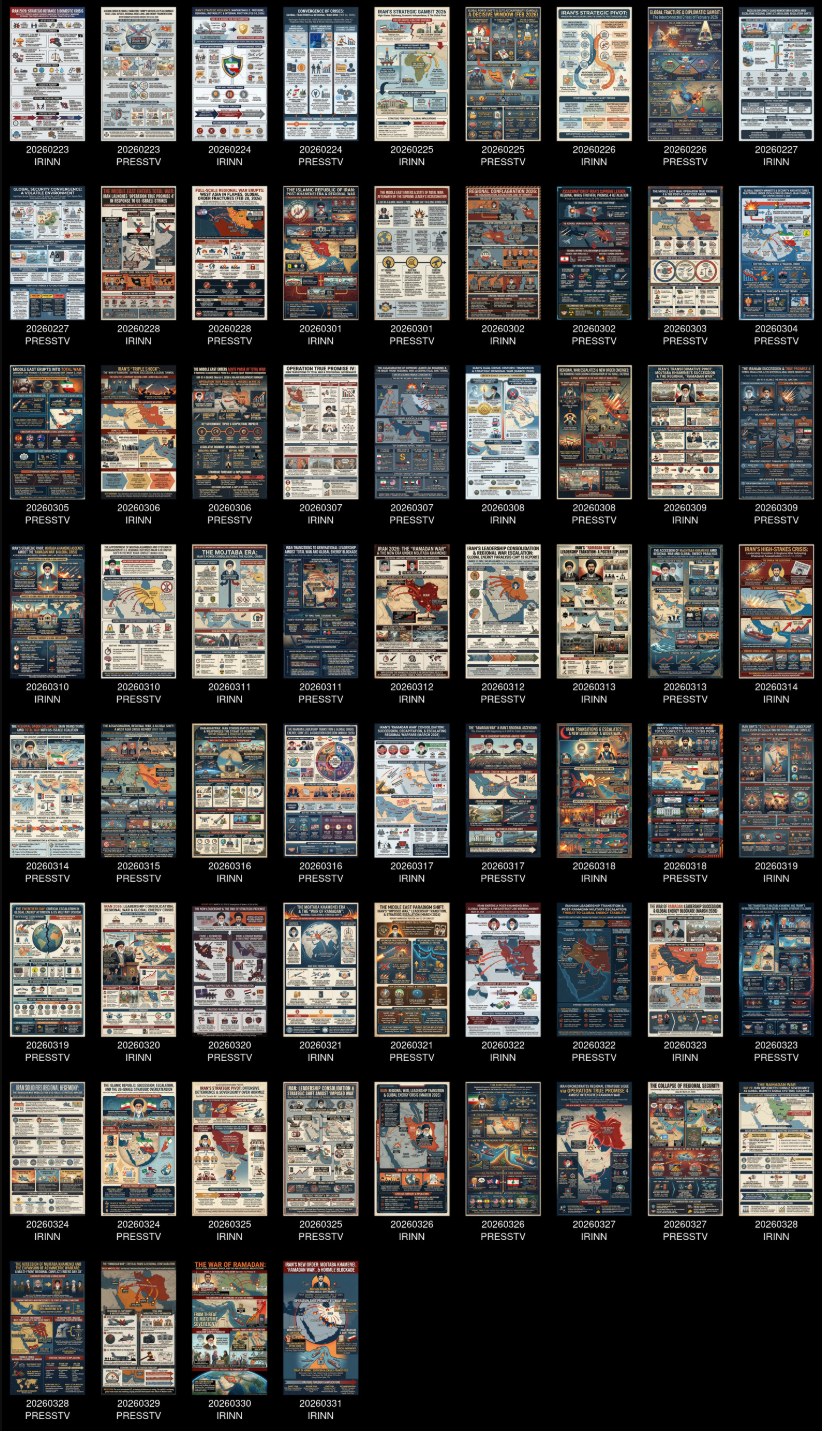
Each morning we use Gemini 3 to deeply analyze the previous day's coverage of Iranian television news channels IRINN and PressTV and write a 6-page report that narrates its central trends, patterns and narratives, which we turn into an infographic using Nano Banana Pro. (No data is used to train or tune any model.) What would it look like to visualize an entire month of these infographics in a single montage to visualize how Iran's domestic and internationally-focused narratives have evolved over the leadup to and course of the conflict?
View the final montage (low resolution / medium resolution / high resolution) (below is a low-resolution preview version).
For those interested, here are the technical details of how we created this montage. The code below was actually created by Gemini 3 as well!
time find *.cover.jpg | parallel --eta 'convert -resize 250x250 {} {.}.250x.jpg'
time find *.cover.jpg | parallel --eta 'convert -resize 500x500 {} {.}.500x.jpg'
time find *.cover.jpg | parallel --eta 'convert -resize 1000x1000 {} {.}.1000x.jpg'
n=$(ls -1 *.250x.jpg | wc -l | awk '{s=sqrt($1); print (s==int(s)) ? s : int(s)+1}'); time montage $(ls *.250x.jpg | awk -F'.' '{print "-label", $1"\\n"$2, $0}') -background black -fill white -pointsize 18 -geometry +15+15 -tile ${n}x${n} 2026-04-01-infographicmontageiran-250px-full.jpg&
n=$(ls -1 *.500x.jpg | wc -l | awk '{s=sqrt($1); print (s==int(s)) ? s : int(s)+1}'); time montage $(ls *.500x.jpg | awk -F'.' '{print "-label", $1"\\n"$2, $0}') -background black -fill white -pointsize 18 -geometry +15+15 -tile ${n}x${n} 2026-04-01-infographicmontageiran-500px-full.jpg&
n=$(ls -1 *.1000x.jpg | wc -l | awk '{s=sqrt($1); print (s==int(s)) ? s : int(s)+1}'); time montage $(ls *.1000x.jpg | awk -F'.' '{print "-label", $1"\\n"$2, $0}') -background black -fill white -pointsize 18 -geometry +15+15 -tile ${n}x${n} 2026-04-01-infographicmontageiran-1000px-full.jpg&