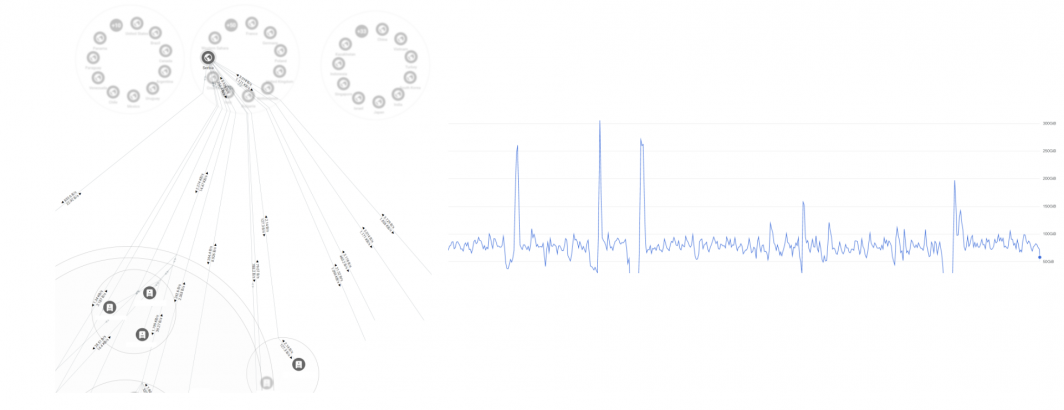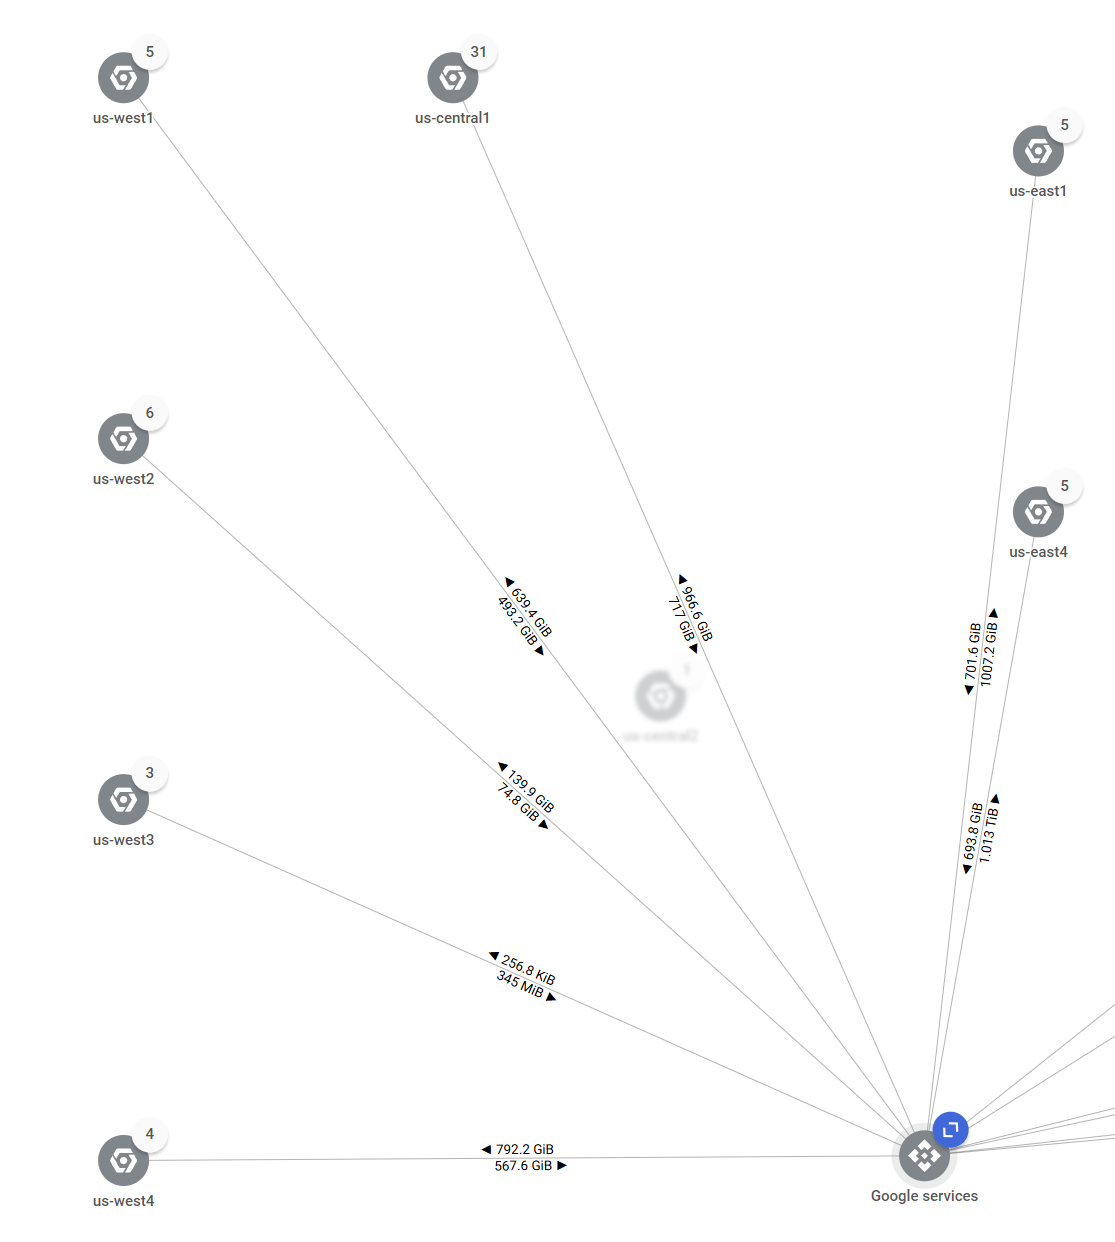
GCP's Network Intelligence service offers an incredibly powerful Network Topology visualization that shows all of the various GCP services being used in a given project and the network flows amongst them. We use it when developing and launching new workflows to better understand their geographic behavior under real world conditions and to observe how they behave when we test their self-healing and self-scaling systems and to diagnose and address any non-linear scaling, error handling and edge case behaviors. Below is a snapshot of our OCR cluster in a very early testing stage as we were ramping it up.
Note how an immediate finding from this graph is that despite us-east1 and us-east4 each having only 5 GCE VMs, they are each averaging 1.7TB ingress+egress over the sample time period – roughly the same as us-central1 with 31 VMs. This was during a test of the automatic scaling infrastructure that had been customized for our OCR workflow and demonstrated clearly that the system was correctly spinning up additional VMs, but was incorrectly assigning them to OCR tasks rather than montaging tasks. The system was correctly identifying that OCR throughput was far below the assigned setpoint, but was failing to see that the culprit was a sudden transient rise in 429 responses from the API that meant that the setpoint QPS could not be achieved, despite being far below quota level, meaning the VMs should have either been assigned to montaging tasks or spun down until the API error rate subsided. While all of this was captured in the infrastructure management plane logs, it is vastly clearer in this simple graph. Moreover, the significantly lower bandwidth in the us-west regions captures how those regions were being used to experiment with different CPU families to explore price/performance ratios for OCR montaging and clearly indicating that the families being evaluated at that moment were struggling to maintain the same performance as those being used in the us-east regions.
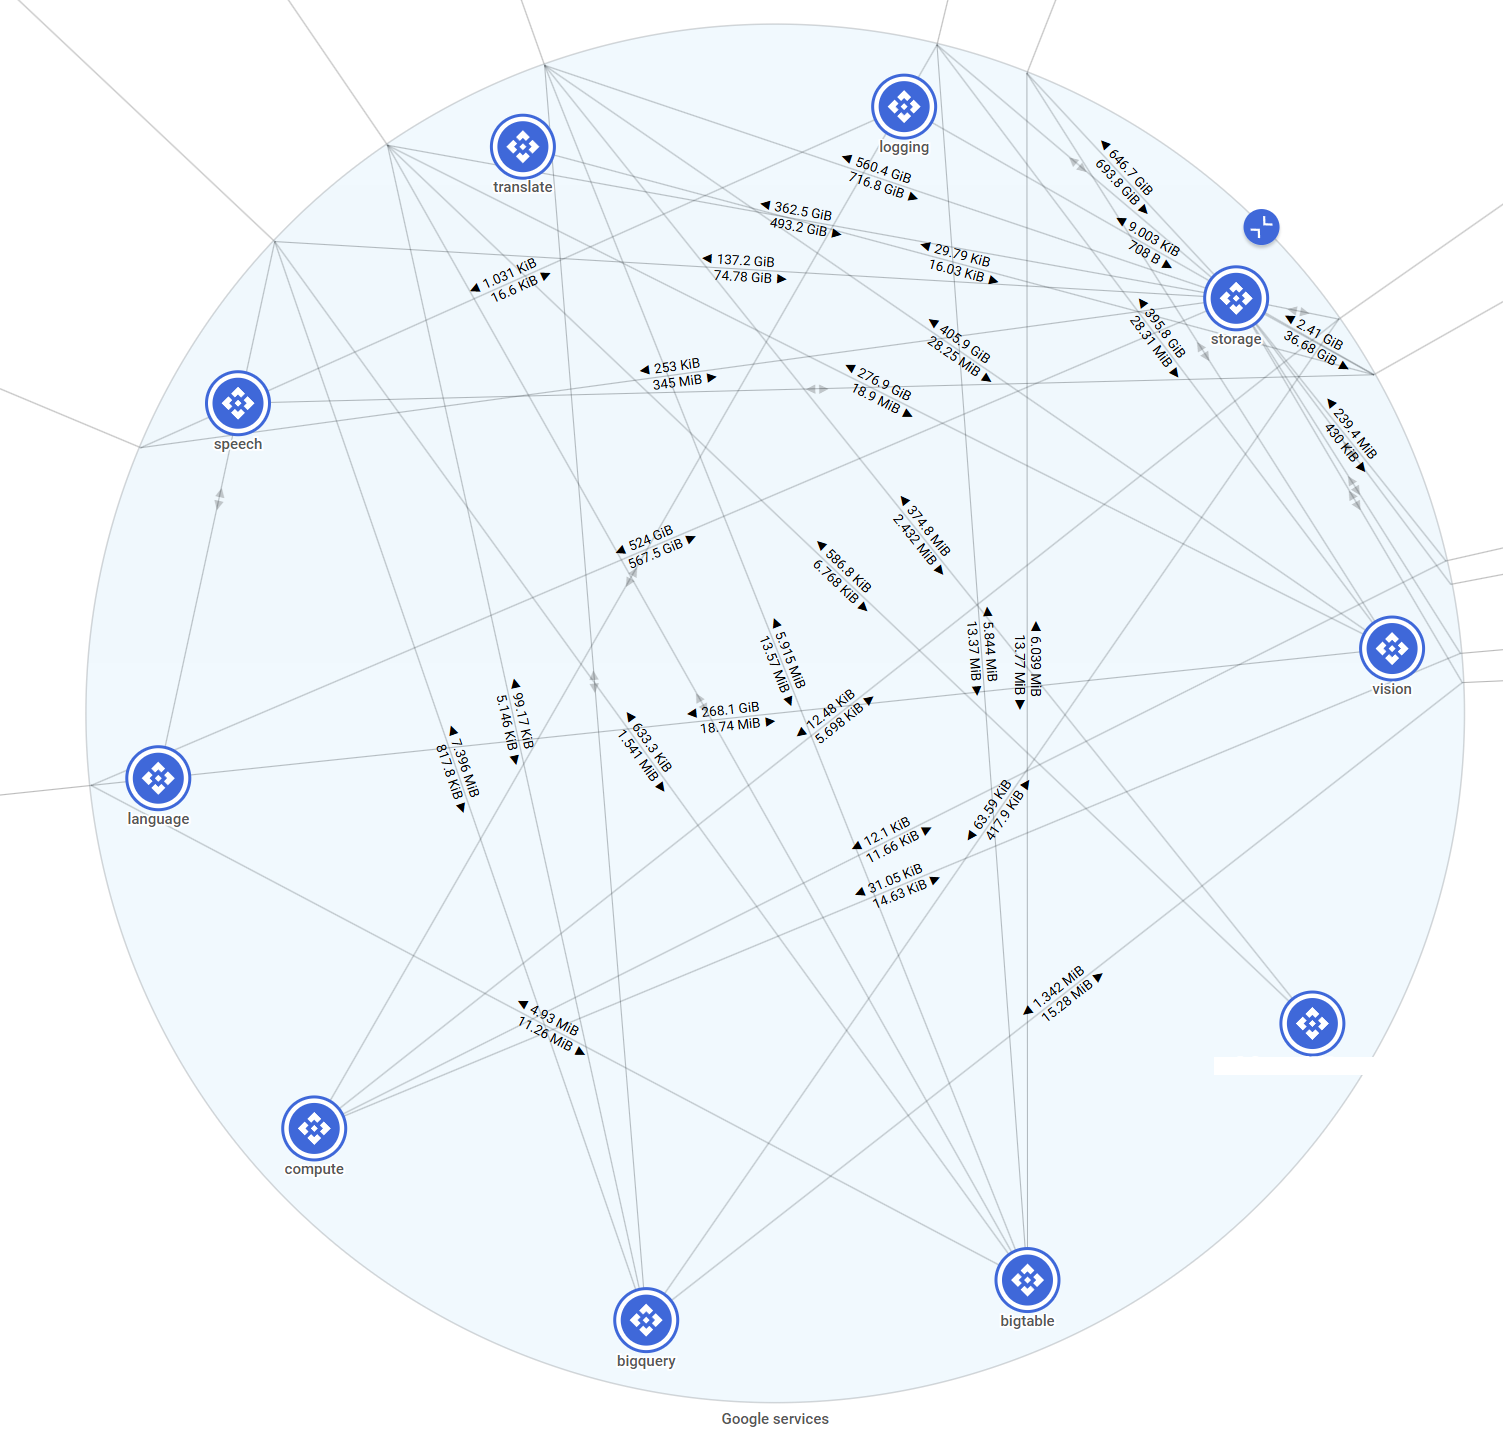
Similarly, the graph below shows the same network visualization zoomed to the GCP services portion, showing the connectivity of these VMs with the underlying GCP services (including additional experiments occurring on this cluster relating to speech and translation). In a reflection of just how rich the Cloud Vision AI API's annotations are, the graph shows that even at this early testing stage, the API was returning just over 500MB/s of JSON annotations.

