
Making it possible for us to perform archive-scale analyses over the massive Internet Archive TV News Archive lies a powerful GCS digital twin over GDELT's analyses of the archive, powered by Bigtable that interfaces transparently with BigQuery to allow us to conduct at-scale analytic overviews. While many of our analyses to date have centered on understanding the TV News Archive itself and its composition and sourcing, this powerful digital twin offers an even more powerful operational capability: the ability to examine GDELT's entire global television news processing infrastructure across the board, spanning both primary and reserve GCE fleets, GCP AI API call results, GCS object store status and the status of all of the myriad ingest and processing systems that power this vast infrastructure. One of the most basic of these operational analyses involves examining the initial ingest status of the entire archive to identify temporary or permanent technical and other failures, both external (a corrupt video that can't be analyzed) and internal (networking, GCS, GCE, Bigtable or other temporary GCP issues) and other issues. Using just a single SQL query (seen at the end of this post) we can generate a complete holistic report over the status of our entire ingest processing infrastructure.
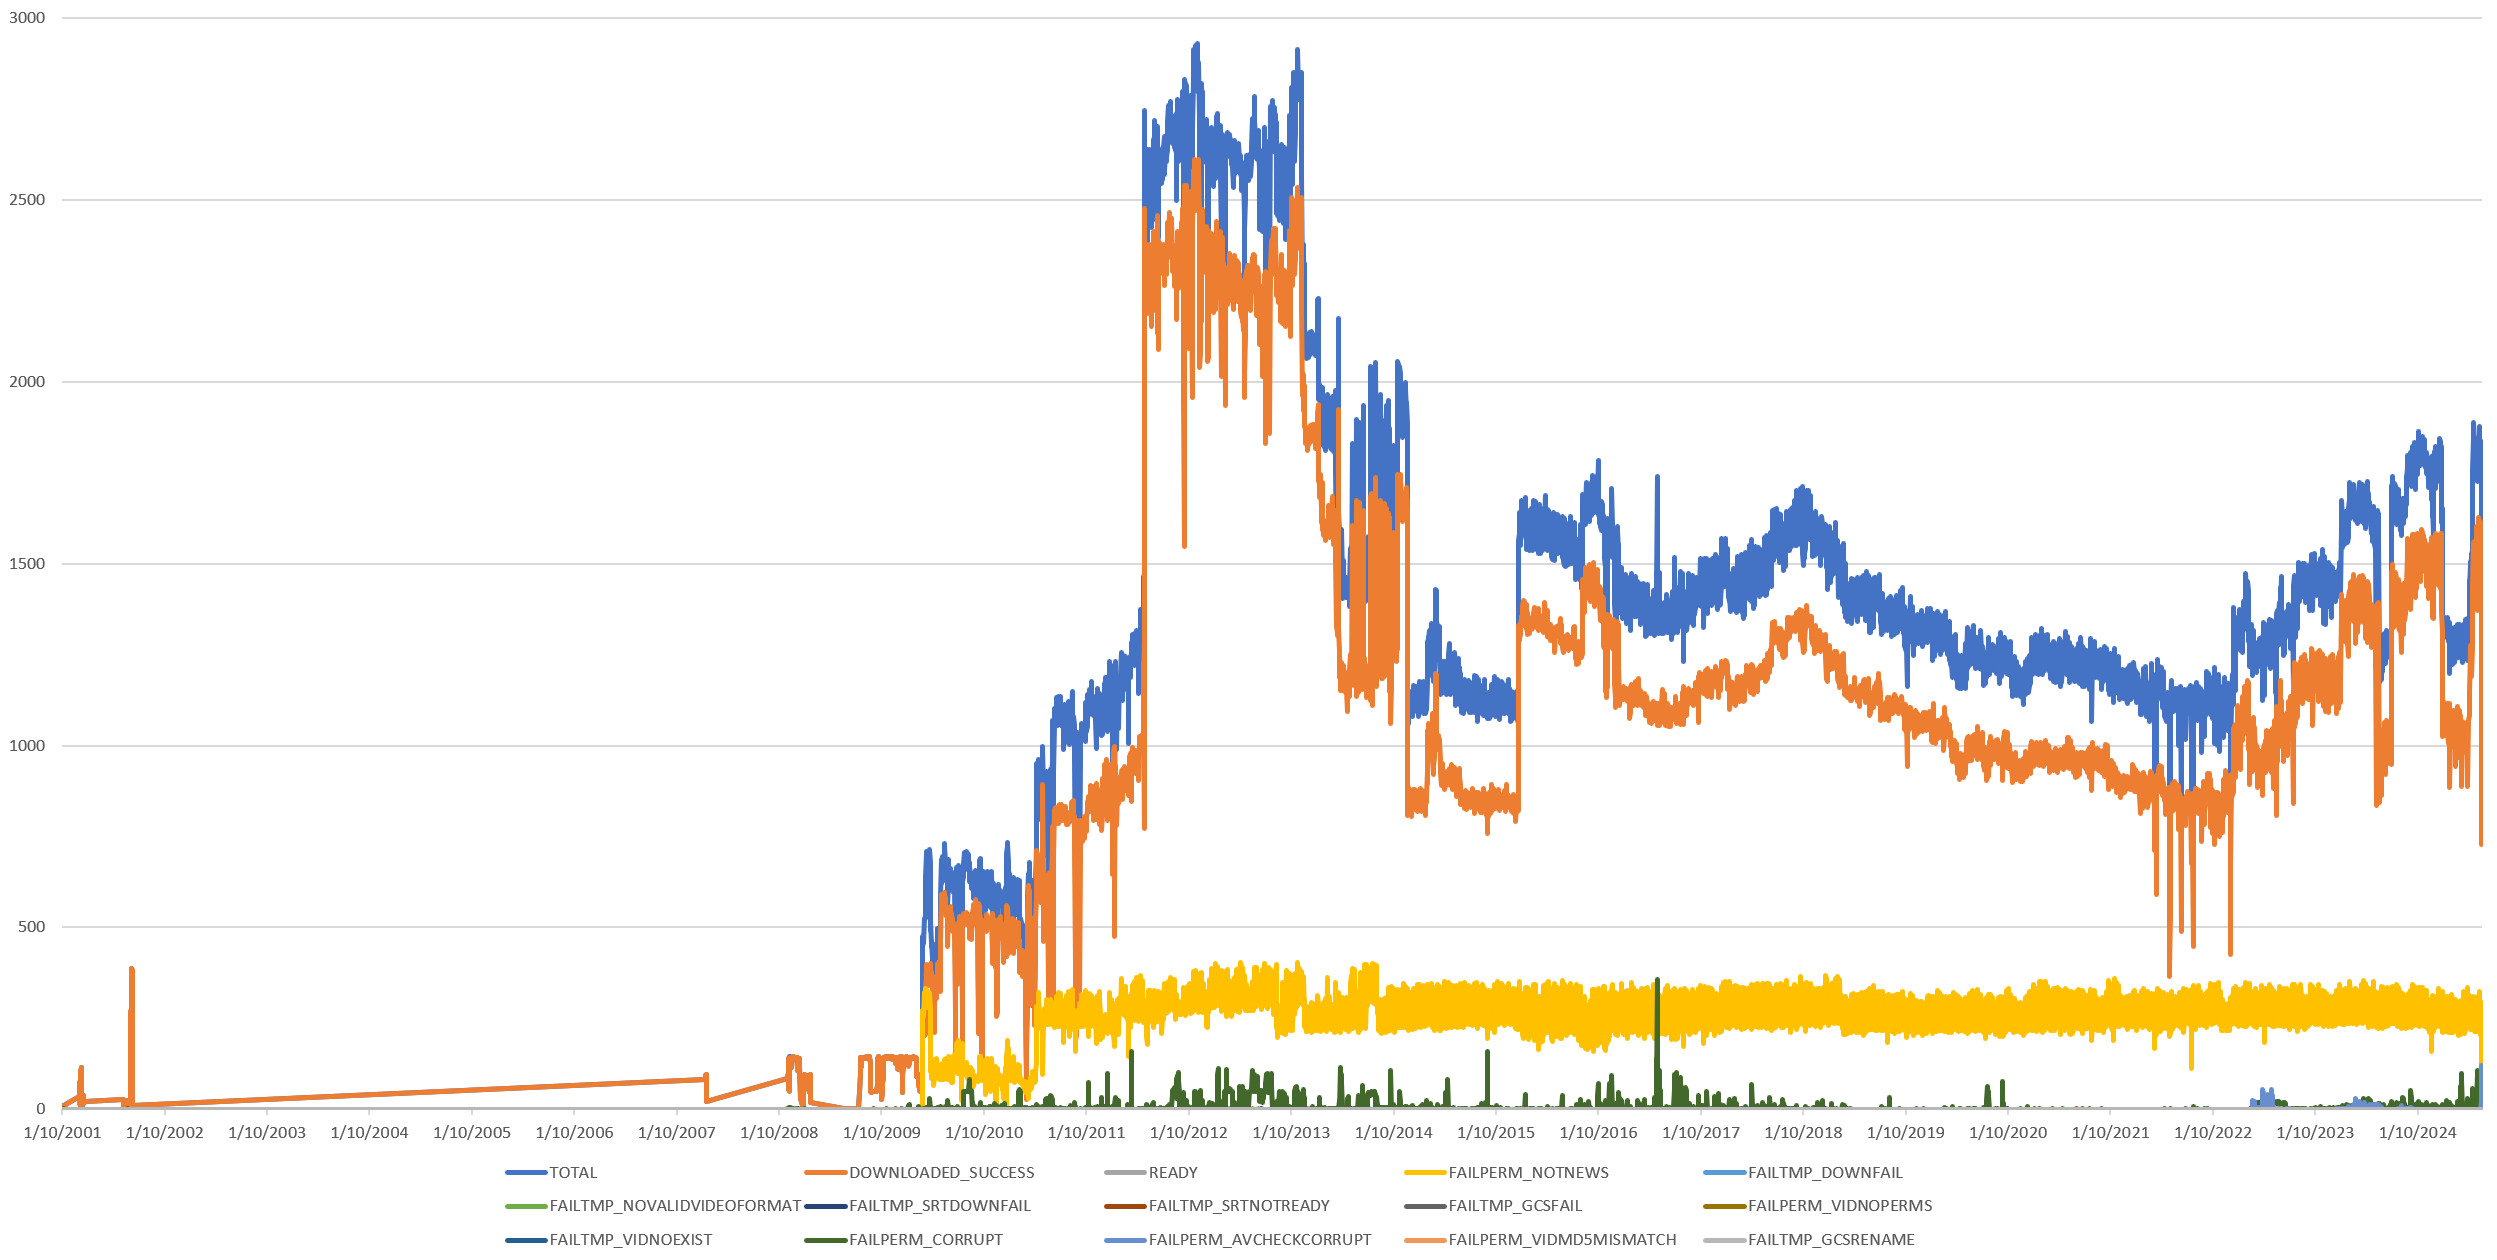
You can see the final timeline below. Blue denotes the total universe of known broadcasts each day, while orange indicates those successfully ingested and prepared for processing. With the massive expansion of the Archive in 2009, yellow denotes non-news programming (entertainment, paid programming, sports, etc) that is excluded from analysis. As each channel is being monitored, each broadcast is classified according to its EPG title information as "news" or "not news" using a set of human curated filters and those determined not to be news are excluded from further analysis, accounting for the discrepancy between the blue and orange timelines. Taking just minutes to construct, this timeline gives us a critical operational look at GDELT's overall system performance and makes it possible to identify longitudinal trends, especially at the channel level, for further investigation.
We can make a histogram via:
select status, count(1) cnt from (
select
  JSON_EXTRACT_SCALAR(DOWN, '$.status') status, DOWN
   FROM (
  SELECT
    rowkey,
    ( select array(select value from unnest(cell))[OFFSET(0)]  from unnest(cf.column) where name in ('DOWN') ) DOWN
  FROM `[PROJECTID].bigtableconnections.digtwin` where  CAST(substr(rowkey, 0, 8) as NUMERIC) > 20000000
 )
)  group by status order by cnt desc
And deep-dive into a specific status code via:
select
  JSON_EXTRACT_SCALAR(DOWN, '$.status') status,JSON_EXTRACT_SCALAR(DOWN, '$.id') id, DOWN
   FROM (
  SELECT
    rowkey,
    ( select array(select value from unnest(cell))[OFFSET(0)]  from unnest(cf.column) where name in ('DOWN') ) DOWN
  FROM `[PROJECTID].bigtableconnections.digtwin` where  CAST(substr(rowkey, 0, 8) as NUMERIC) > 20000000 and rowkey like '2024083%'
 ) WHERE JSON_EXTRACT_SCALAR(DOWN, '$.status') IN ('FAILTMP_CORRUPT')