With today being the 20th anniversary of the genocide in Rwanda, we've received a number of requests for visualizations and insights that show what “big data” analysis of the news media can tell us about the conflict.
Similar to the visualization of Nigeria in 2014, we’ve created a TimeMapper visualization, courtesy of the GDELT Analysis Service, of all Material Conflict in Rwanda 1979 to present, showing the contours of the country’s unrest.
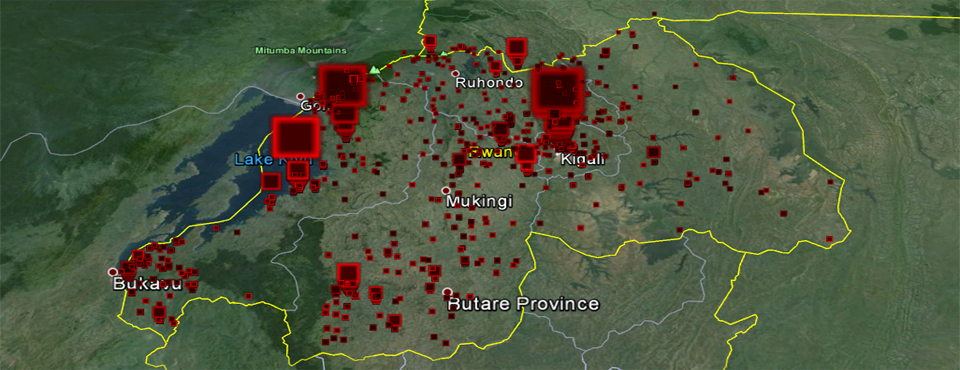
At each location the visualization sums up the total number of events at that location on that date, so clicking on a point will show you how many total events were found at that location on that date, and display a sample URL of one of those events. Points are sized based on the number of events there (larger dots indicate more events occurred there on that date).
All events are timecoded, so Google Earth will display its “time slider” tool in the upper-left of your screen and you can adjust to a more narrow time slice and move through time. Try setting the time slider to a 1- or 2-week time period and scroll the time slider back and forth – you can see “waves” of events, especially in the south of the country.
Give it a try for yourself! Right-click on the link below and download it to your computer, then make sure you have Google Earth installed on your computer and open the file in Google Earth and check it out!