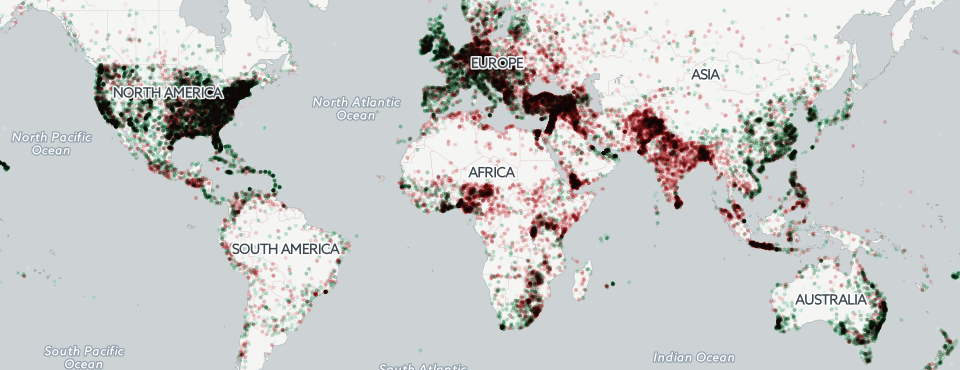
In a similar vein to the 2015 global conflict map, the map below compiles a list of every location on earth mentioned on at least 16 distinct days in 2015 and color-codes it by the average "tone" (emotion/sentiment) of all worldwide coverage mentioning that location over all of 2015, from bright green (very happy) to bright red (very unhappy).
Click on the image below to launch the interactive zoomable map.
TECHNICAL DETAILS
The final query to generate the map aggregates the 2015 GKG 2.0 dataset by unique location (using the Geographic FeatureID to normalize for different spellings and transliterations of a given location name), filters for the number of unique days in which that location was mentioned, and compiles the average tone of all of those mentions across 2015.
select location, REGEXP_REPLACE(location, r',.*', '') locationname, REGEXP_REPLACE(location, r'^.*,', '') locationcountry, featureid, latitude, longitude, avgtone, stddevtone, cnt, numdays from (

select min(location) location, max(latitude) latitude, max(longitude) longitude, featureid, AVG(tone) avgtone, stddev(tone) stddevtone, min(tone) mintone, max(tone) maxtone, count(1) cnt, count(distinct(DATE)) numdays from (

SELECT REGEXP_EXTRACT(SPLIT(V2Locations,';'),r'^[2-5]#(.*?)#') as location,
REGEXP_EXTRACT(SPLIT(V2Locations,';'),r'^[2-5]#.*?#.*?#.*?#.*?#(.*?)#') as latitude,
REGEXP_EXTRACT(SPLIT(V2Locations,';'),r'^[2-5]#.*?#.*?#.*?#.*?#.*?#(.*?)#') as longitude,
REGEXP_EXTRACT(SPLIT(V2Locations,';'),r'^[2-5]#.*?#.*?#.*?#.*?#.*?#.*?#(.*?)#') as featureid,
float(REGEXP_REPLACE(V2Tone, r',.*', "")) tone,
substr(string(DATE), 1, 8) DATE
FROM [gdelt-bq:gdeltv2.gkg]

) where featureid is not null group by featureid order by cnt desc

) where numdays > 15
Alternatively, the following query rounds each location mention to a 0.01 grid and averages the tone for each grid cell, rather than at the resolution of individual locations. This is useful, for example, for grouping together the city of Chicago, major buildings there, and all of its various outlying suburbs into a single metro area, rather than treating them all as distinct and separate entities, or for aligning disparate geographic datasets for macro-level analysis.
select latitude, longitude, avgtone, stddevtone, mintone, maxtone, cnt from (

select latitude, longitude, AVG(tone) avgtone, stddev(tone) stddevtone, min(tone) mintone, max(tone) maxtone, count(1) cnt from (

SELECT REGEXP_EXTRACT(SPLIT(V2Locations,';'),r'^[2-5]#(.*?)#') as location,
ROUND(FLOAT(REGEXP_EXTRACT(SPLIT(V2Locations,';'),r'^[2-5]#.*?#.*?#.*?#.*?#(.*?)#')),2) as latitude,
ROUND(FLOAT(REGEXP_EXTRACT(SPLIT(V2Locations,';'),r'^[2-5]#.*?#.*?#.*?#.*?#.*?#(.*?)#')),2) as longitude,
REGEXP_EXTRACT(SPLIT(V2Locations,';'),r'^[2-5]#.*?#.*?#.*?#.*?#.*?#.*?#(.*?)#') as featureid,
float(REGEXP_REPLACE(V2Tone, r',.*', '')) tone,

FROM [gdelt-bq:gdeltv2.gkg]  WHERE DATE>=20150200000000 and DATE<=20150299999999

) where featureid is not null group by latitude,longitude order by cnt desc

) where cnt > 50
