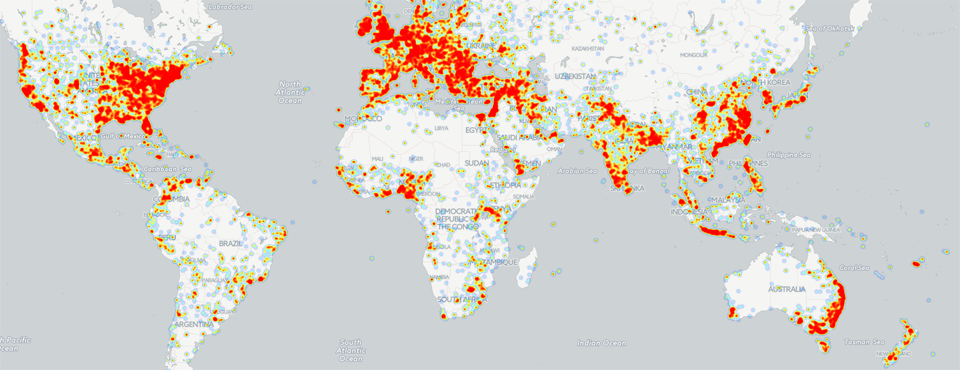
Felipe Hoffa, Developer Advocate on big data at Google, put together this fantastic tutorial creating a heatmap of a day in the life of the global news media as seen through the eyes of GDELT using Google BigQuery and CartoDB. The map plots out all worldwide locations mentioned in a single day of global news coverage across all 100 languages monitored by GDELT (65 of which are live machine translated), using the copy of the GDELT Global Knowledge Graph from GDELT 2.0 that is available in Google BigQuery.
In his Reddit post, Felipe walks through the process he used to create the map, including his BigQuery SQL query, a re:dash interface, and the streamlined process of importing into CartoDB using their new "oneclick" interface. Felipe shows how to integrate BigQuery "table decorators" to limit a query to just the previous 24 hours of data, vastly reducing query costs and computation time.
The resulting map, seen below, shows the world as seen through the eyes of GDELT during a single 24 hour period. Keep in mind that this represents just a single day and not every single location on earth may have been mentioned heavily during that particular day. Most critically, the points on this map are NOT sized on volume, so a small rural village with just a few mentions will appear the same size on this map as a major metropolitian city. The close geographic proximity and spacing of European and the eastern half of the United States is what causes them to appear dark red on this map, while Latin America's greater spacing between population centers makes it appear more sparse. If you zoom further into the map, however, you can begin to see the population centers better. If you look closely, you'll notice that the map above closely matches global population density estimates for 2015, especially when clustering metro areas into their centroid points as GDELT does.
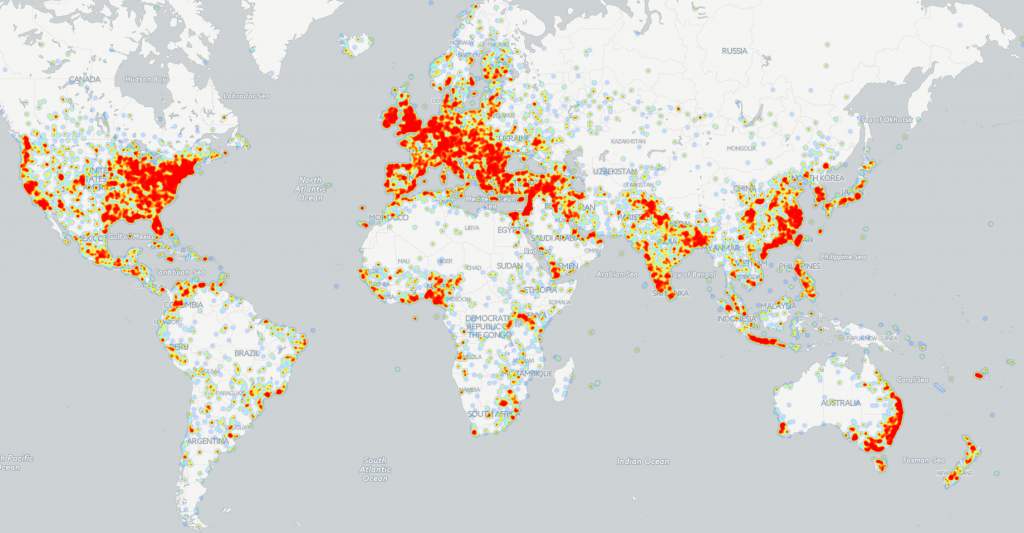
Click on map to launch interactive zoomable map view)
Further Reading:
Read the Full Reddit Technical Post With BigQuery Instructions.
See the Interative Zoomable Map in CartoDB.
Felipe's Tweet Announcing His 1 Minute Tutorial.