Google recently released Google Cloud Datalab which provides a cloud-hosted version of Jupyter/IPython that is tightly coupled with Google BigQuery, Google Compute Engine and Google Cloud Storage. The use of standard Python and SQL and extremely strong integration with Google BigQuery makes for an ideal combination to rapidly analyze, visualize, and explore GDELT in a unified environment.
To help get you started, Felipe Hoffa helped us create a really simple IPython notebook that you can import directly into your own Cloud Datalab instance to begin exploring GDELT. You'll need to launch your own Cloud Datalab instance, which will incur charges, and then load this notebook into your instance and follow along. In case you haven't started exploring Datalab yet, the remainder of this post shows the demonstration code and examples used in the Notebook.
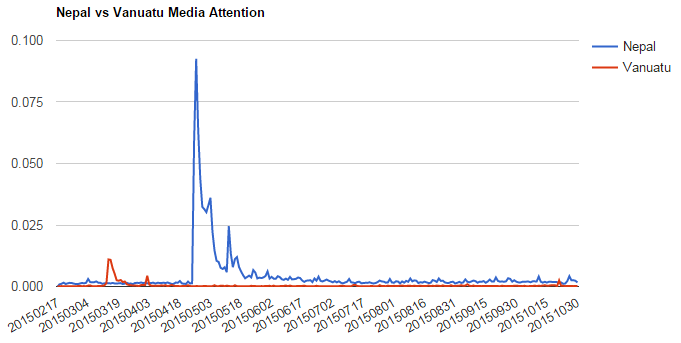
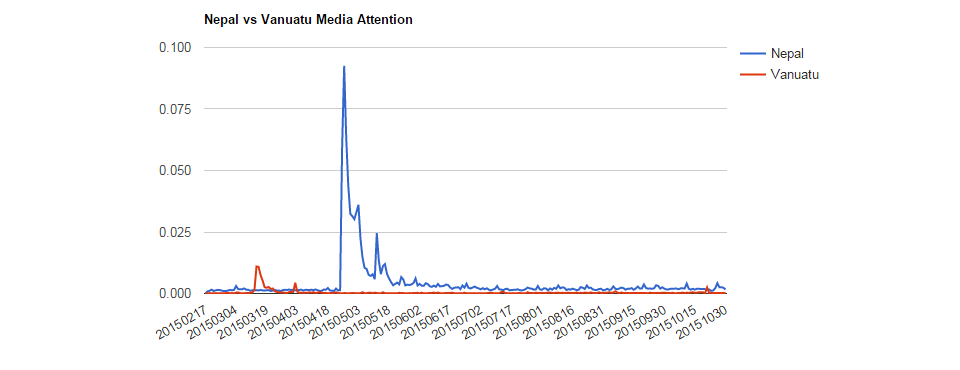
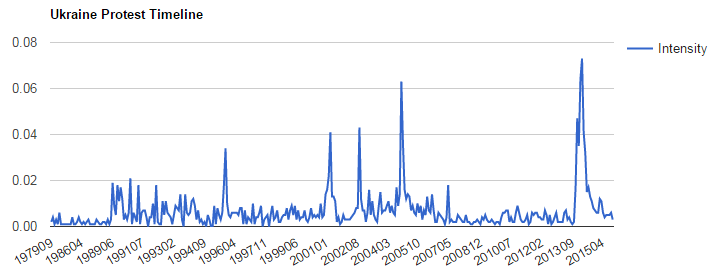
In the code below you'll see three simple examples. The first measures the overall conflict intensity of Ukraine by month since January 1979, while the second assesses overall protest intensity of Ukraine instead, showing the different profiles. Finally, the third example assesses media attention towards Vanuatu and Nepal by day since February 19, 2015, showing how the GKG can be used to explore what the media is covering regardless of physical events.
Download the IPython Notebook.
%%sql --module ukraineconflicttimeline

#NOTE: string(MonthYear) converts the date to a string so the timeline below will treat as categorical labels
SELECT string(MonthYear) MonthYear, INTEGER(norm*100000)/1000 Intensity
FROM (
SELECT ActionGeo_CountryCode, QuadClass, MonthYear, COUNT(1) AS c, RATIO_TO_REPORT(c) OVER(PARTITION BY MonthYear ORDER BY c DESC) norm FROM [gdelt-bq:full.events]
GROUP BY ActionGeo_CountryCode, QuadClass, MonthYear
)
WHERE ActionGeo_CountryCode='UP' and QuadClass=4
ORDER BY ActionGeo_CountryCode, QuadClass, MonthYear;
%%chart line --fields MonthYear,Intensity --data ukraineconflicttimeline
height: 300
title: 'Ukraine Conflict Timeline'

%%sql --module ukraineprotesttimeline

#NOTE: string(MonthYear) converts the date to a string so the timeline below will treat as categorical labels
SELECT string(MonthYear) MonthYear, INTEGER(norm*100000)/1000 Intensity
FROM (
SELECT ActionGeo_CountryCode, EventRootCode, MonthYear, COUNT(1) AS c, RATIO_TO_REPORT(c) OVER(PARTITION BY MonthYear ORDER BY c DESC) norm FROM [gdelt-bq:full.events]
GROUP BY ActionGeo_CountryCode, EventRootCode, MonthYear
)
WHERE ActionGeo_CountryCode='UP' and EventRootCode='14'
ORDER BY ActionGeo_CountryCode, EventRootCode, MonthYear;
%%chart line --fields MonthYear,Intensity --data ukraineprotesttimeline
height: 300
title: 'Ukraine Protest Timeline'
%%sql --module nepalvanuatumediaattention

SELECT day, sum_nepal/c Nepal, sum_vanuatu/c Vanuatu
FROM (
select string(integer(DATE/1000000)) as day, SUM(V2Locations like '%Nepal%') sum_nepal, SUM(V2Locations like '%Vanuatu%') sum_vanuatu, count(1) c
FROM [gdelt-bq:gdeltv2.gkg]
 group by day )
order by day
%%chart line --fields day,Nepal,Vanuatu --data nepalvanuatumediaattention
height: 400
title: 'Nepal vs Vanuatu Media Attention'