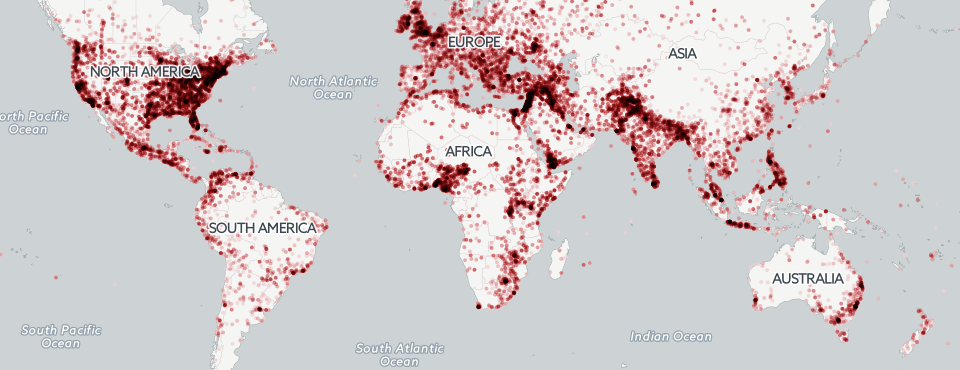
Three years ago we showed off the results of a singularly incredible BigQuery query, courtesy of the one and only Felipe Hoffa, that processes the entire GDELT 1.0 Event database and compiles a timeline spanning the last four decades, listing the top five countries that experienced the greatest increase in their instability level each year. In essence, the query tallies the total number of instability events by country each year, uses this to rank all countries globally by their overall instability that year, compares each country's rank against its rank from the previous year and finally outputs a master list of the top five countries experiencing the greatest jump in instability in that year compared with the previous year. Since the query only measures change in instability, rather than absolute instability levels, it surfaces the key underlying instability stories of each year, rather than simply reporting the same conflict zones year after year. While the query does not perform any kind of normalization, the results are a powerful glimpse into the macro level global instability patterns captured in GDELT's nearly four decades of data.
We decided to rerun the query to see what the results look like looking back over what is now 39 years of data and a total of just over half a billion events in the GDELT 1.0 Event database. As a testament to just how powerful BigQuery really is, the single block of SQL code below processes 514 million records spanning 39 years in just 3.1 seconds, consuming just 9.55GB of query data. You read that right – a 514M record database of global human society processed in just over 3 seconds to yield a master summary of the biggest instability stories of each year 1980-present.
SELECT YEAR, GROUP_CONCAT(country) countries,
 GROUP_CONCAT(STRING(rank)) rankings, GROUP_CONCAT(STRING(jump)) jumps
FROM
 (SELECT YEAR, country, rank, jump
 FROM
 (SELECT YEAR, country, rank, prevrank, prevrank-rank jump, (prevrank-rank)/rank jumpratio,
 RANK() OVER(PARTITION BY YEAR ORDER BY jumpratio DESC) jumprank
 FROM
 ( SELECT YEAR, ActionGeo_CountryCode, rank,
 LAG(rank) OVER(PARTITION BY ActionGeo_CountryCode ORDER BY YEAR) prevrank
 FROM
 (SELECT YEAR, ActionGeo_CountryCode,
 RANK() OVER(PARTITION BY YEAR ORDER BY c DESC) rank, c
 FROM
 (SELECT YEAR, ActionGeo_CountryCode, COUNT(*) c
 FROM [gdelt-bq:full.events]
 WHERE ActionGeo_CountryCode IS NOT NULL and QuadClass=4
 GROUP BY 1, 2))) a
 JOIN [gdelt-bq:extra.countryinfo] b ON ActionGeo_CountryCode=fips
 WHERE prevrank-rank > 5 AND rank < 50)
 WHERE jumprank<6
 ORDER BY 1,rank)
GROUP BY 1
ORDER BY 1 DESC
And here is the table itself, showing the top countries by year (2018 numbers are as of May 11, 2018). If you look closely, you will see a mixture of interstate conflicts, armed rebellions, terrorist attacks and labor uprisings.
It is important to remember that the rankings below measure change in instability from the previous year, meaning that countries that experience consistently high conflict, such as Syria in recent years, or which have back-to-back events, such as Turkey's 2016 coup which followed the deadliest terror attack in its history in 2015, which in turn followed armed confrontations the year before that, will not typically have a high ranking, since while their instability levels are high, they do not change enough to yield a high "change" score. In essence, the countries below represent those that experienced sudden change from the status quo, while countries that experienced a succession of major situations will not typically make the list.
Using the query above, you can adjust the ranking criteria to come up with all sorts of different country rankings and timelines, including ones that will surface sustained or multiyear instability situations, all while yielding results in just a few seconds over half a billion records.
Explore!
| Year | Countries | Rankings | Jumps |
| 2018 | Italy,New Zealand,Palestinian Territory,Sri Lanka,Poland | 26,40,41,43,47 | 7,6,12,12,11 |
| 2017 | North Korea,South Korea,Spain,Myanmar,Venezuela | 19,26,27,42,44 | 15,10,11,17,25 |
| 2016 | Belgium,North Korea,South Korea,Uganda,Brazil | 28,34,36,43,46 | 17,24,7,11,13 |
| 2015 | Saudi Arabia,Bangladesh,Indonesia,Tunisia,Nepal | 18,25,28,47,48 | 14,10,9,25,18 |
| 2014 | Iraq,Ukraine,Nigeria,Palestinian Territory,South Sudan | 5,9,10,38,44 | 8,40,6,19,15 |
| 2013 | Egypt,France,Mali,Algeria,North Korea | 6,9,32,38,42 | 8,6,18,33,23 |
| 2012 | Russia,Nigeria,South Africa,Lebanon,Myanmar | 8,10,18,19,39 | 6,9,6,9,22 |
| 2011 | Libya,Syria,Egypt,Tunisia,Bahrain | 3,7,8,31,35 | 83,50,18,105,71 |
| 2010 | Mexico,Yemen,South Korea,Sweden,Haiti | 13,20,25,38,45 | 6,8,9,28,77 |
| 2009 | Iran,Nigeria,Yemen,North Korea,Ghana | 8,18,28,36,47 | 8,14,23,26,41 |
| 2008 | Canada,Mexico,Zimbabwe,Colombia,Georgia | 11,23,27,28,37 | 8,13,16,14,34 |
| 2007 | Australia,Philippines,Myanmar,Libya,Algeria | 10,15,35,45,47 | 12,11,40,47,27 |
| 2006 | Lebanon,Sri Lanka,Somalia,Canada,Chad | 7,13,20,21,48 | 15,27,32,29,55 |
| 2005 | Kenya,Syria,Egypt,Lebanon,Ethiopia | 10,17,18,22,47 | 6,22,11,18,25 |
| 2004 | Sudan,Nepal,Haiti,Rwanda,Uzbekistan | 19,22,30,35,48 | 32,14,41,18,30 |
| 2003 | Iraq,Iran,Saudi Arabia,Syria,Morocco | 2,12,19,39,49 | 10,7,17,40,35 |
| 2002 | Nigeria,Uganda,Nepal,Ivory Coast,Liberia | 7,13,23,33,37 | 6,12,22,59,35 |
| 2001 | Afghanistan,Macedonia,Palestinian Territory,Bangladesh,Nepal | 4,7,14,38,45 | 22,98,10,33,32 |
| 2000 | Philippines,Nigeria,Palestinian Territory,Malaysia,Fiji | 4,8,24,28,44 | 19,11,61,23,114 |
| 1999 | Serbia,East Timor,Australia,Macedonia,Serbia and Montenegro | 17,22,30,32,47 | 28,72,22,47,53 |
| 1998 | Albania,Indonesia,Kenya,Angola,Malaysia | 5,12,23,28,42 | 6,13,16,30,28 |
| 1997 | Pakistan,Albania,Cambodia,Democratic Republic of the Congo,Zambia | 7,11,23,26,44 | 10,48,14,32,33 |
| 1996 | Iraq,Lebanon,Iran,Liberia,Uganda | 6,12,13,39,43 | 10,10,11,38,33 |
| 1995 | Croatia,Japan,Philippines,Sri Lanka,Peru | 6,13,14,15,30 | 7,16,11,19,37 |
| 1994 | France,Rwanda,Mexico,Yemen,Indonesia | 6,10,17,30,31 | 10,60,13,56,23 |
| 1993 | Bosnia and Herzegovina,Egypt,Somalia,Angola,Haiti | 4,9,12,17,32 | 8,14,17,13,35 |
| 1992 | Turkey,Bosnia and Herzegovina,Azerbaijan,Moldova,Tajikistan | 6,12,15,35,49 | 8,99,30,70,96 |
| 1991 | Croatia,Turkey,Italy,Slovenia,Georgia | 4,14,27,39,49 | 76,10,24,90,46 |
| 1990 | Iraq,Kuwait,Liberia,Azerbaijan,Lithuania | 3,15,18,26,40 | 40,68,95,46,65 |
| 1989 | China,Colombia,El Salvador,Cambodia,Romania | 4,9,12,23,39 | 13,15,17,20,48 |
| 1988 | Palestinian Territory,Myanmar,Panama,Armenia,Azerbaijan | 10,19,22,28,41 | 35,71,19,104,142 |
| 1987 | Iraq,Saudi Arabia,Chad,Kuwait,Panama | 6,25,27,29,41 | 6,35,35,28,47 |
| 1986 | Libya,Peru,Sweden,Haiti,Yemen | 6,26,39,44,48 | 19,14,32,50,86 |
| 1985 | South Africa,Mexico,Uganda,Taiwan,New Zealand | 2,22,35,42,46 | 7,16,28,31,60 |
| 1984 | India,Iraq,Sri Lanka,Nigeria,Saudi Arabia | 3,12,31,35,42 | 17,11,17,15,27 |
| 1983 | Nicaragua,Philippines,Chad,Chile,Grenada | 7,15,31,32,38 | 15,15,44,32,71 |
| 1982 | Argentina,Honduras,Somalia,Bulgaria,Ethiopia | 6,24,35,40,45 | 34,14,26,50,32 |
| 1981 | El Salvador,Poland,Egypt,Honduras,Sudan | 7,8,10,38,43 | 9,9,11,40,45 |
| 1980 | Iraq,Afghanistan,El Salvador,Guatemala,Liberia | 4,5,16,33,44 | 24,12,15,40,51 |
