What does it look like to turn the DNI's 2026 Annual Threat Assessment (ATA) into an infographic using Gemini 3.1 Flash, Nano Banana Pro and Nano Banana 2? Let's try several different workflows applied directly to the PDF.
First let's try a two-step process and turn the full PDF into an infographic prompt using Gemini 3.1 Pro:
Give me a prompt to create a large illustrated explainer poster designed to be printed on a large-format poster printer and hung up on the wall that narrates the attached briefing as a single large poster that can be printed and hung on a wall that outlines all of the core details. It should cover all of its key details.
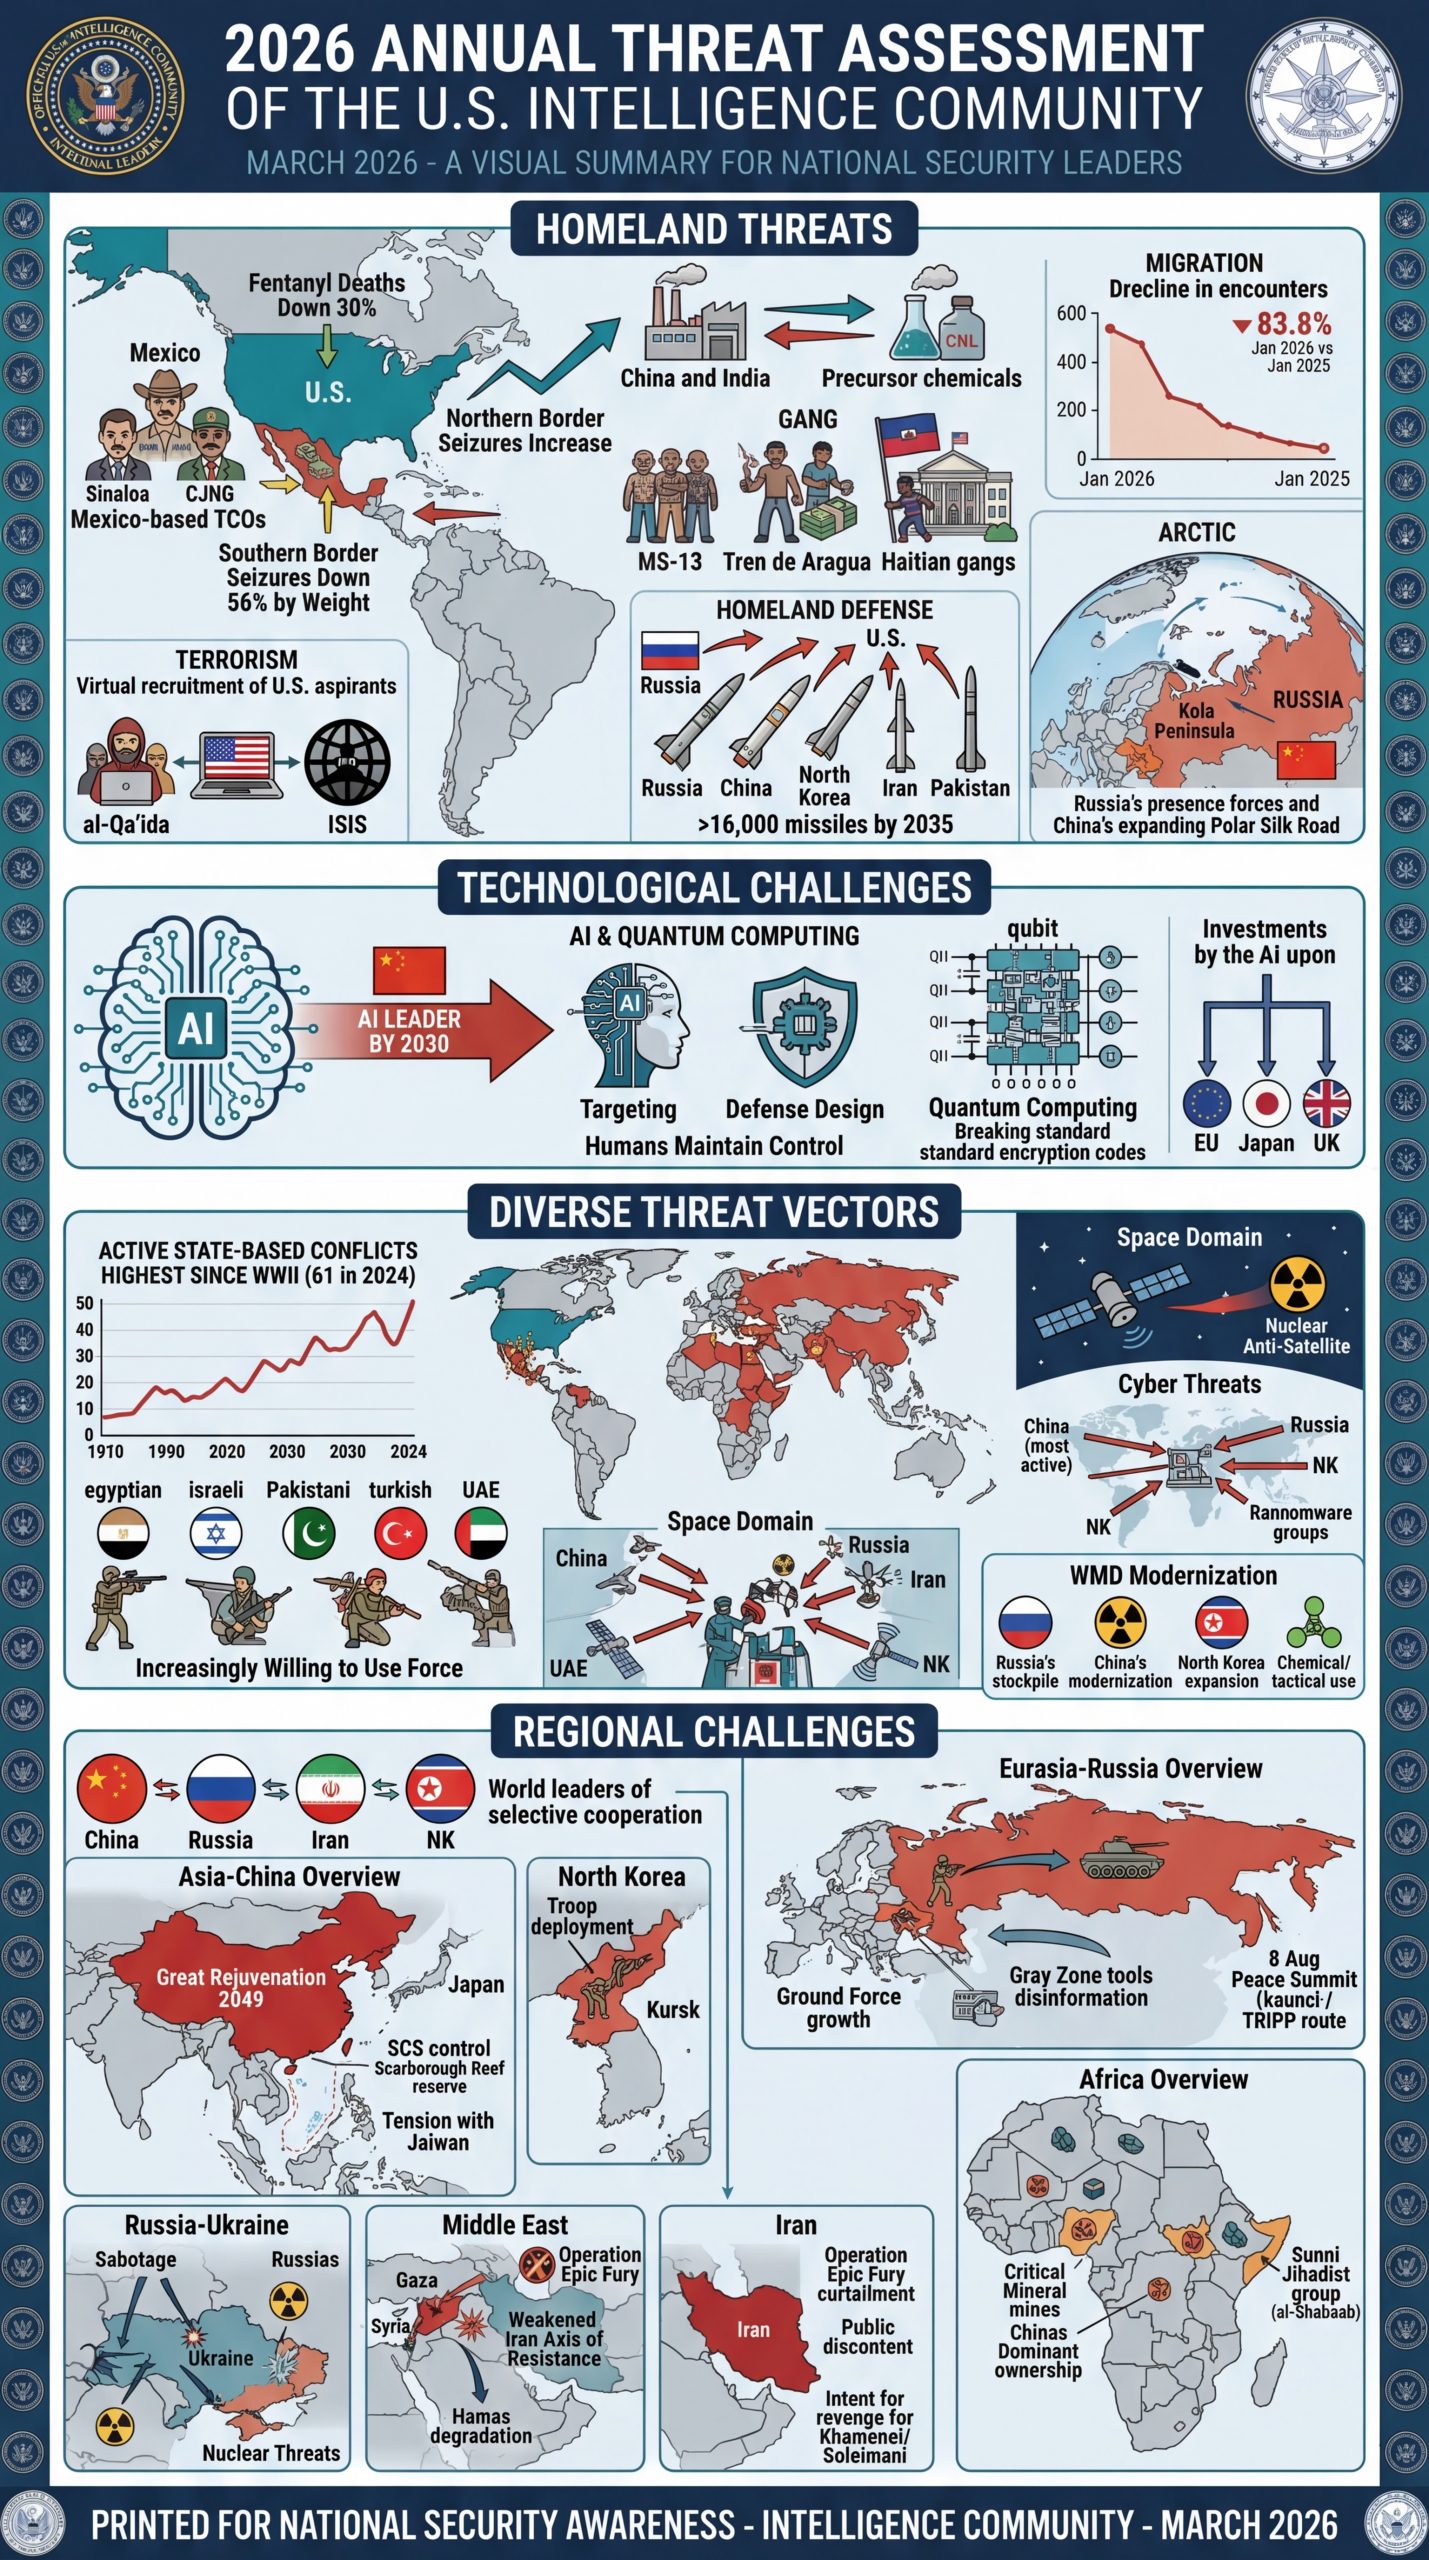
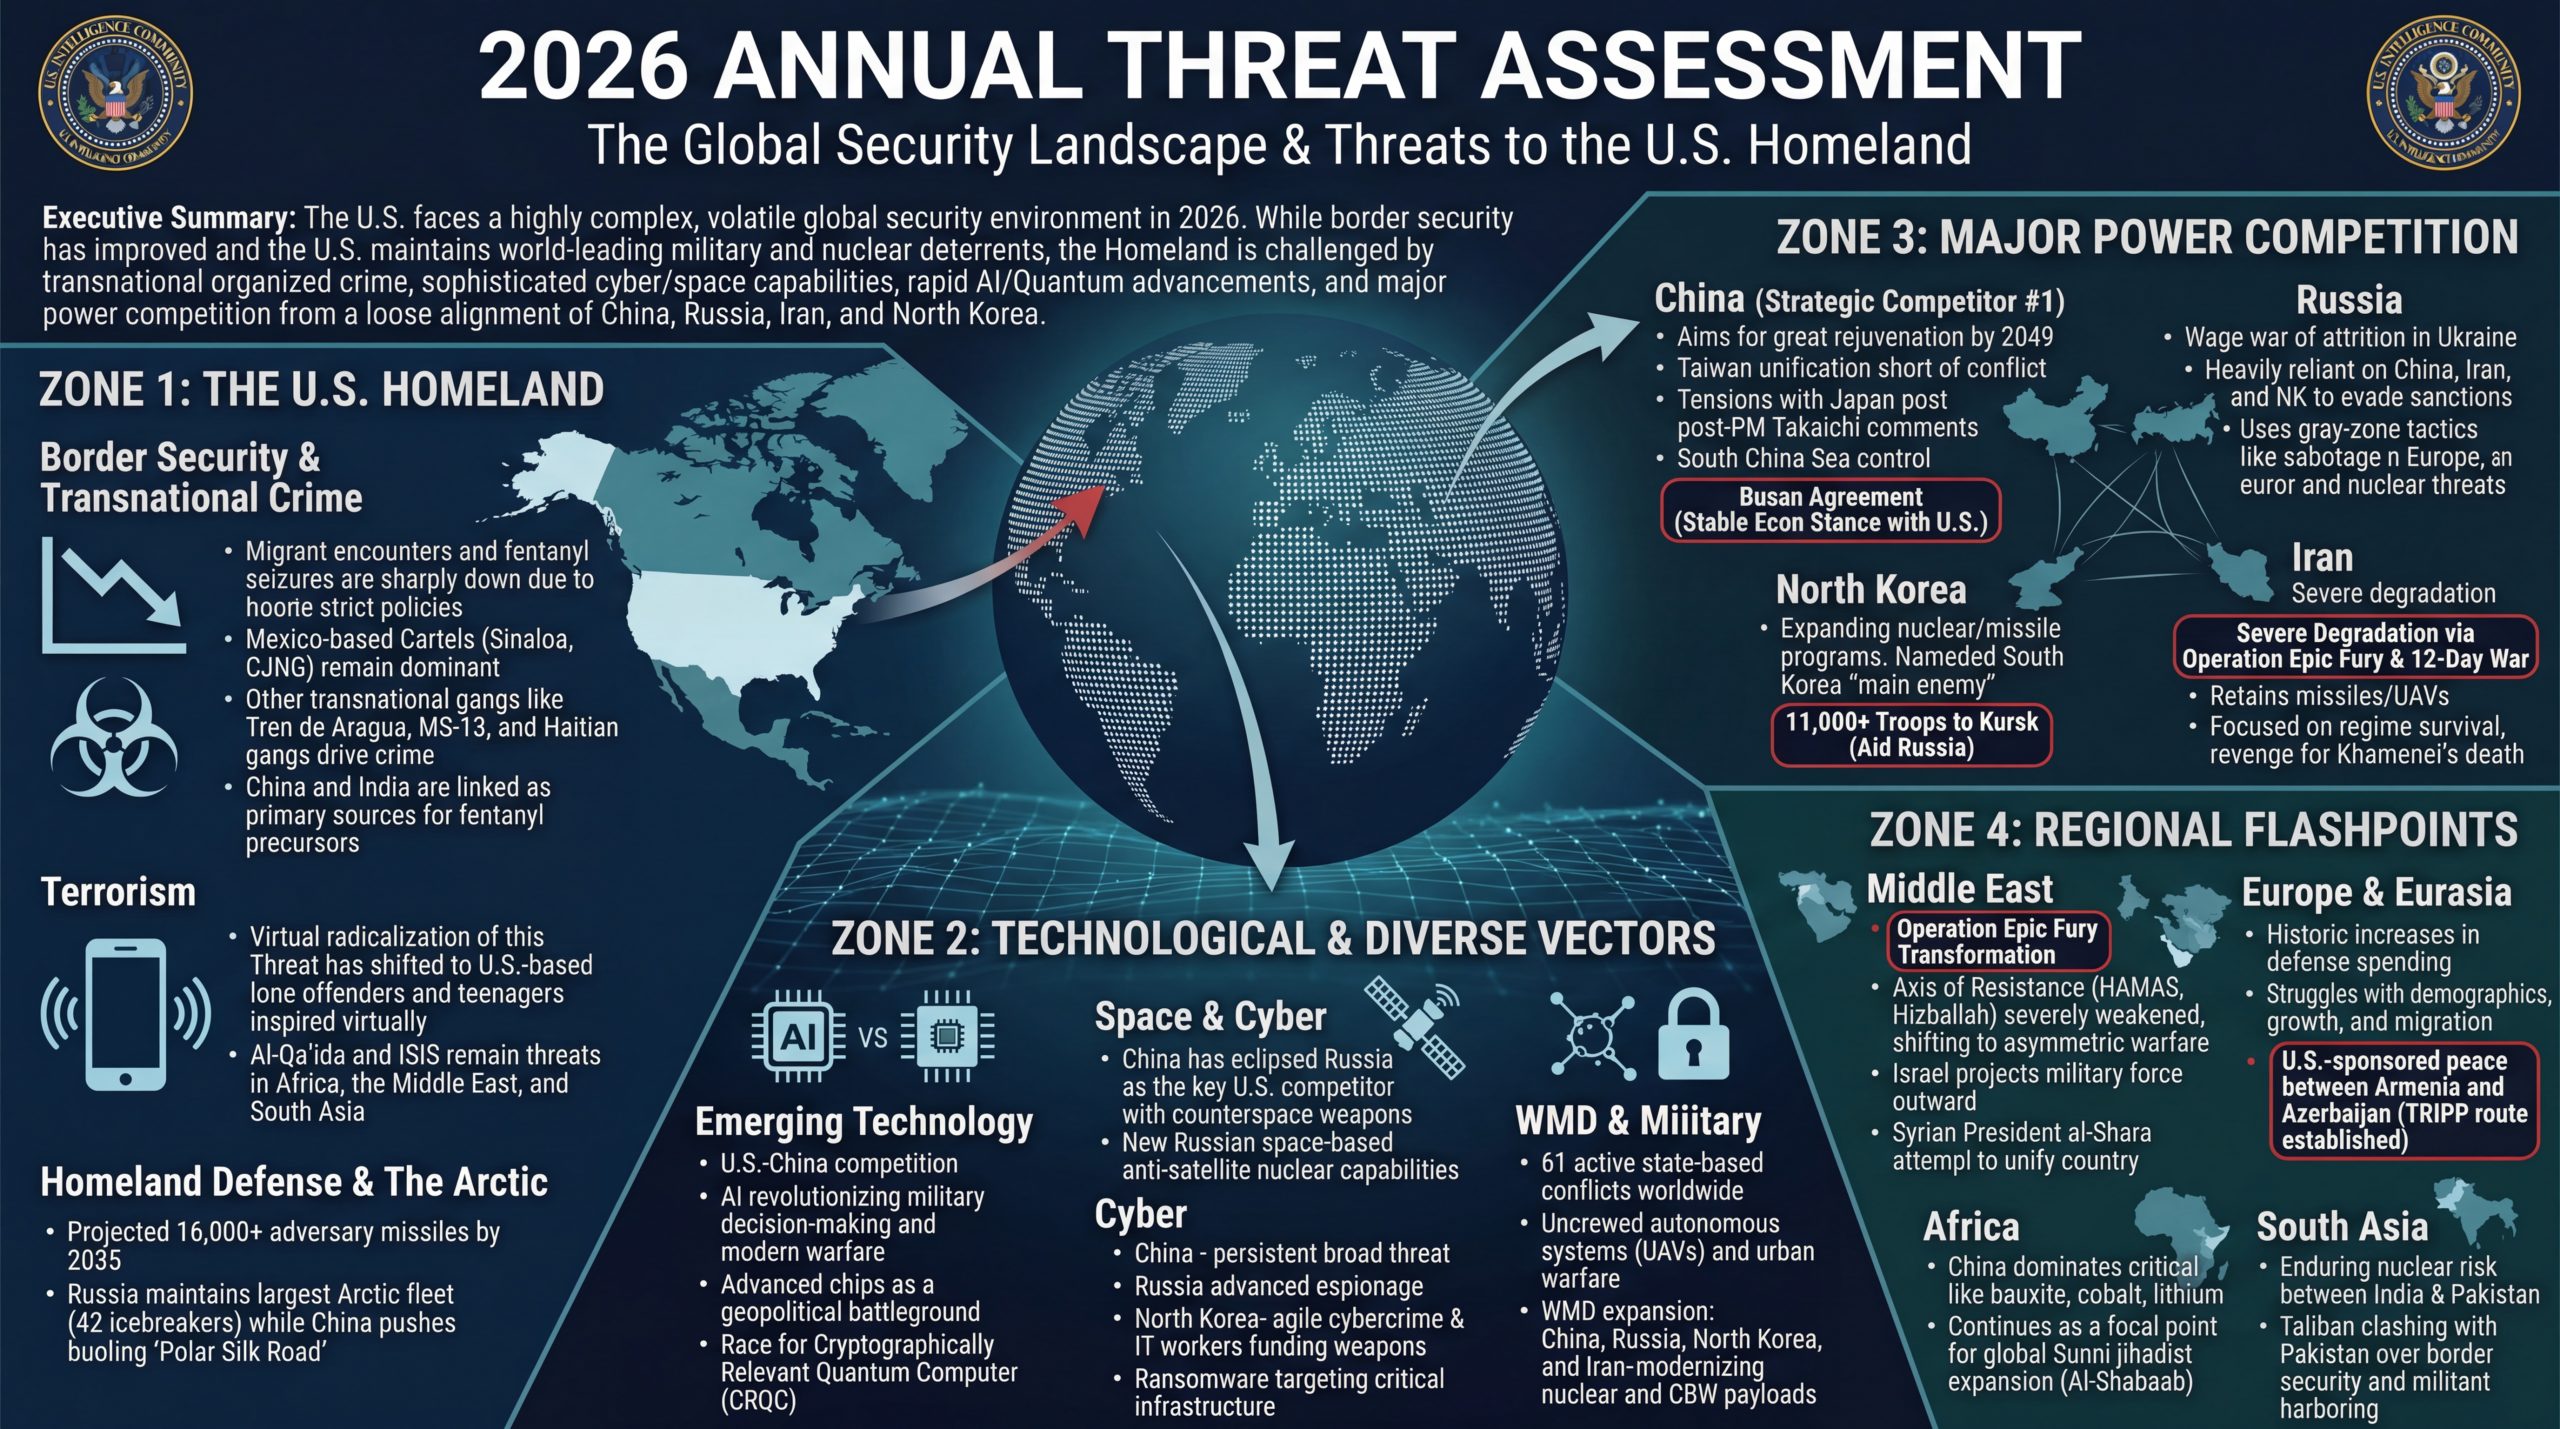
And visualize it using Nano Banana Pro:
Create a large illustrated explainer poster designed to be printed on a large-format poster printer and hung up on the wall that narrates the attached briefing as a single large poster that can be printed and hung on a wall that outlines all of the core details. It should cover all of its key details.
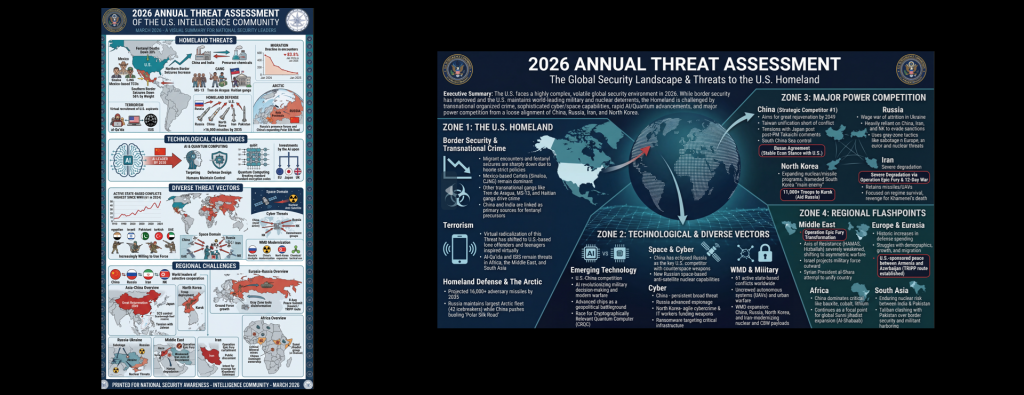
Let's start with Nano Banana Pro (gemini-3-pro-image-preview) at 1K:
And at 4K:
And now let's try Nano Banana 2 (gemini-3.1-flash-image-preview) at 4K and High Thinking Level. Visually this looks nearly identical to Nano Banana due to our using the same input prompt:
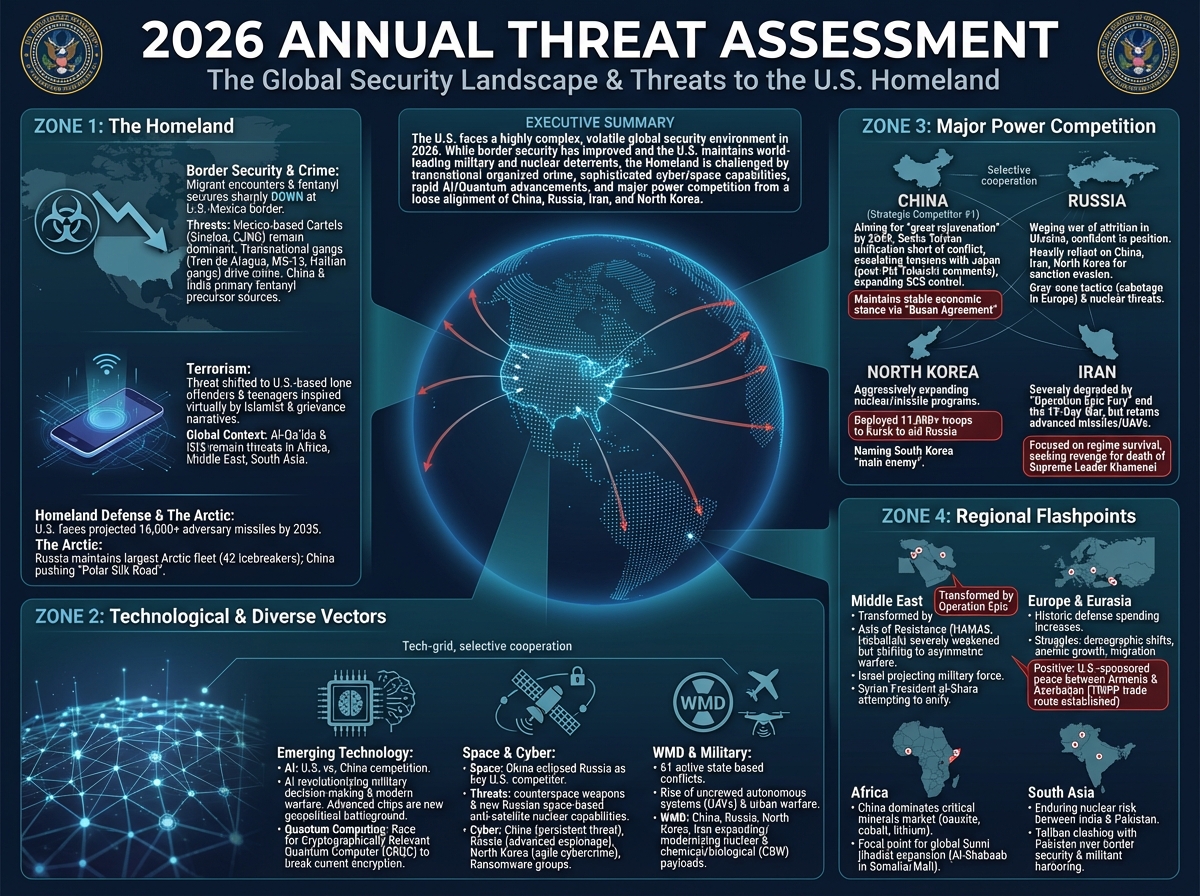
In this case, the report is small enough to fit entirely within Nano Banana's context window, so rather than use Gemini 3.1 Flash to first preprocess the report, let's provide the PDF as-is to Nano Banana Pro with our same prompt, allowing the model full control:
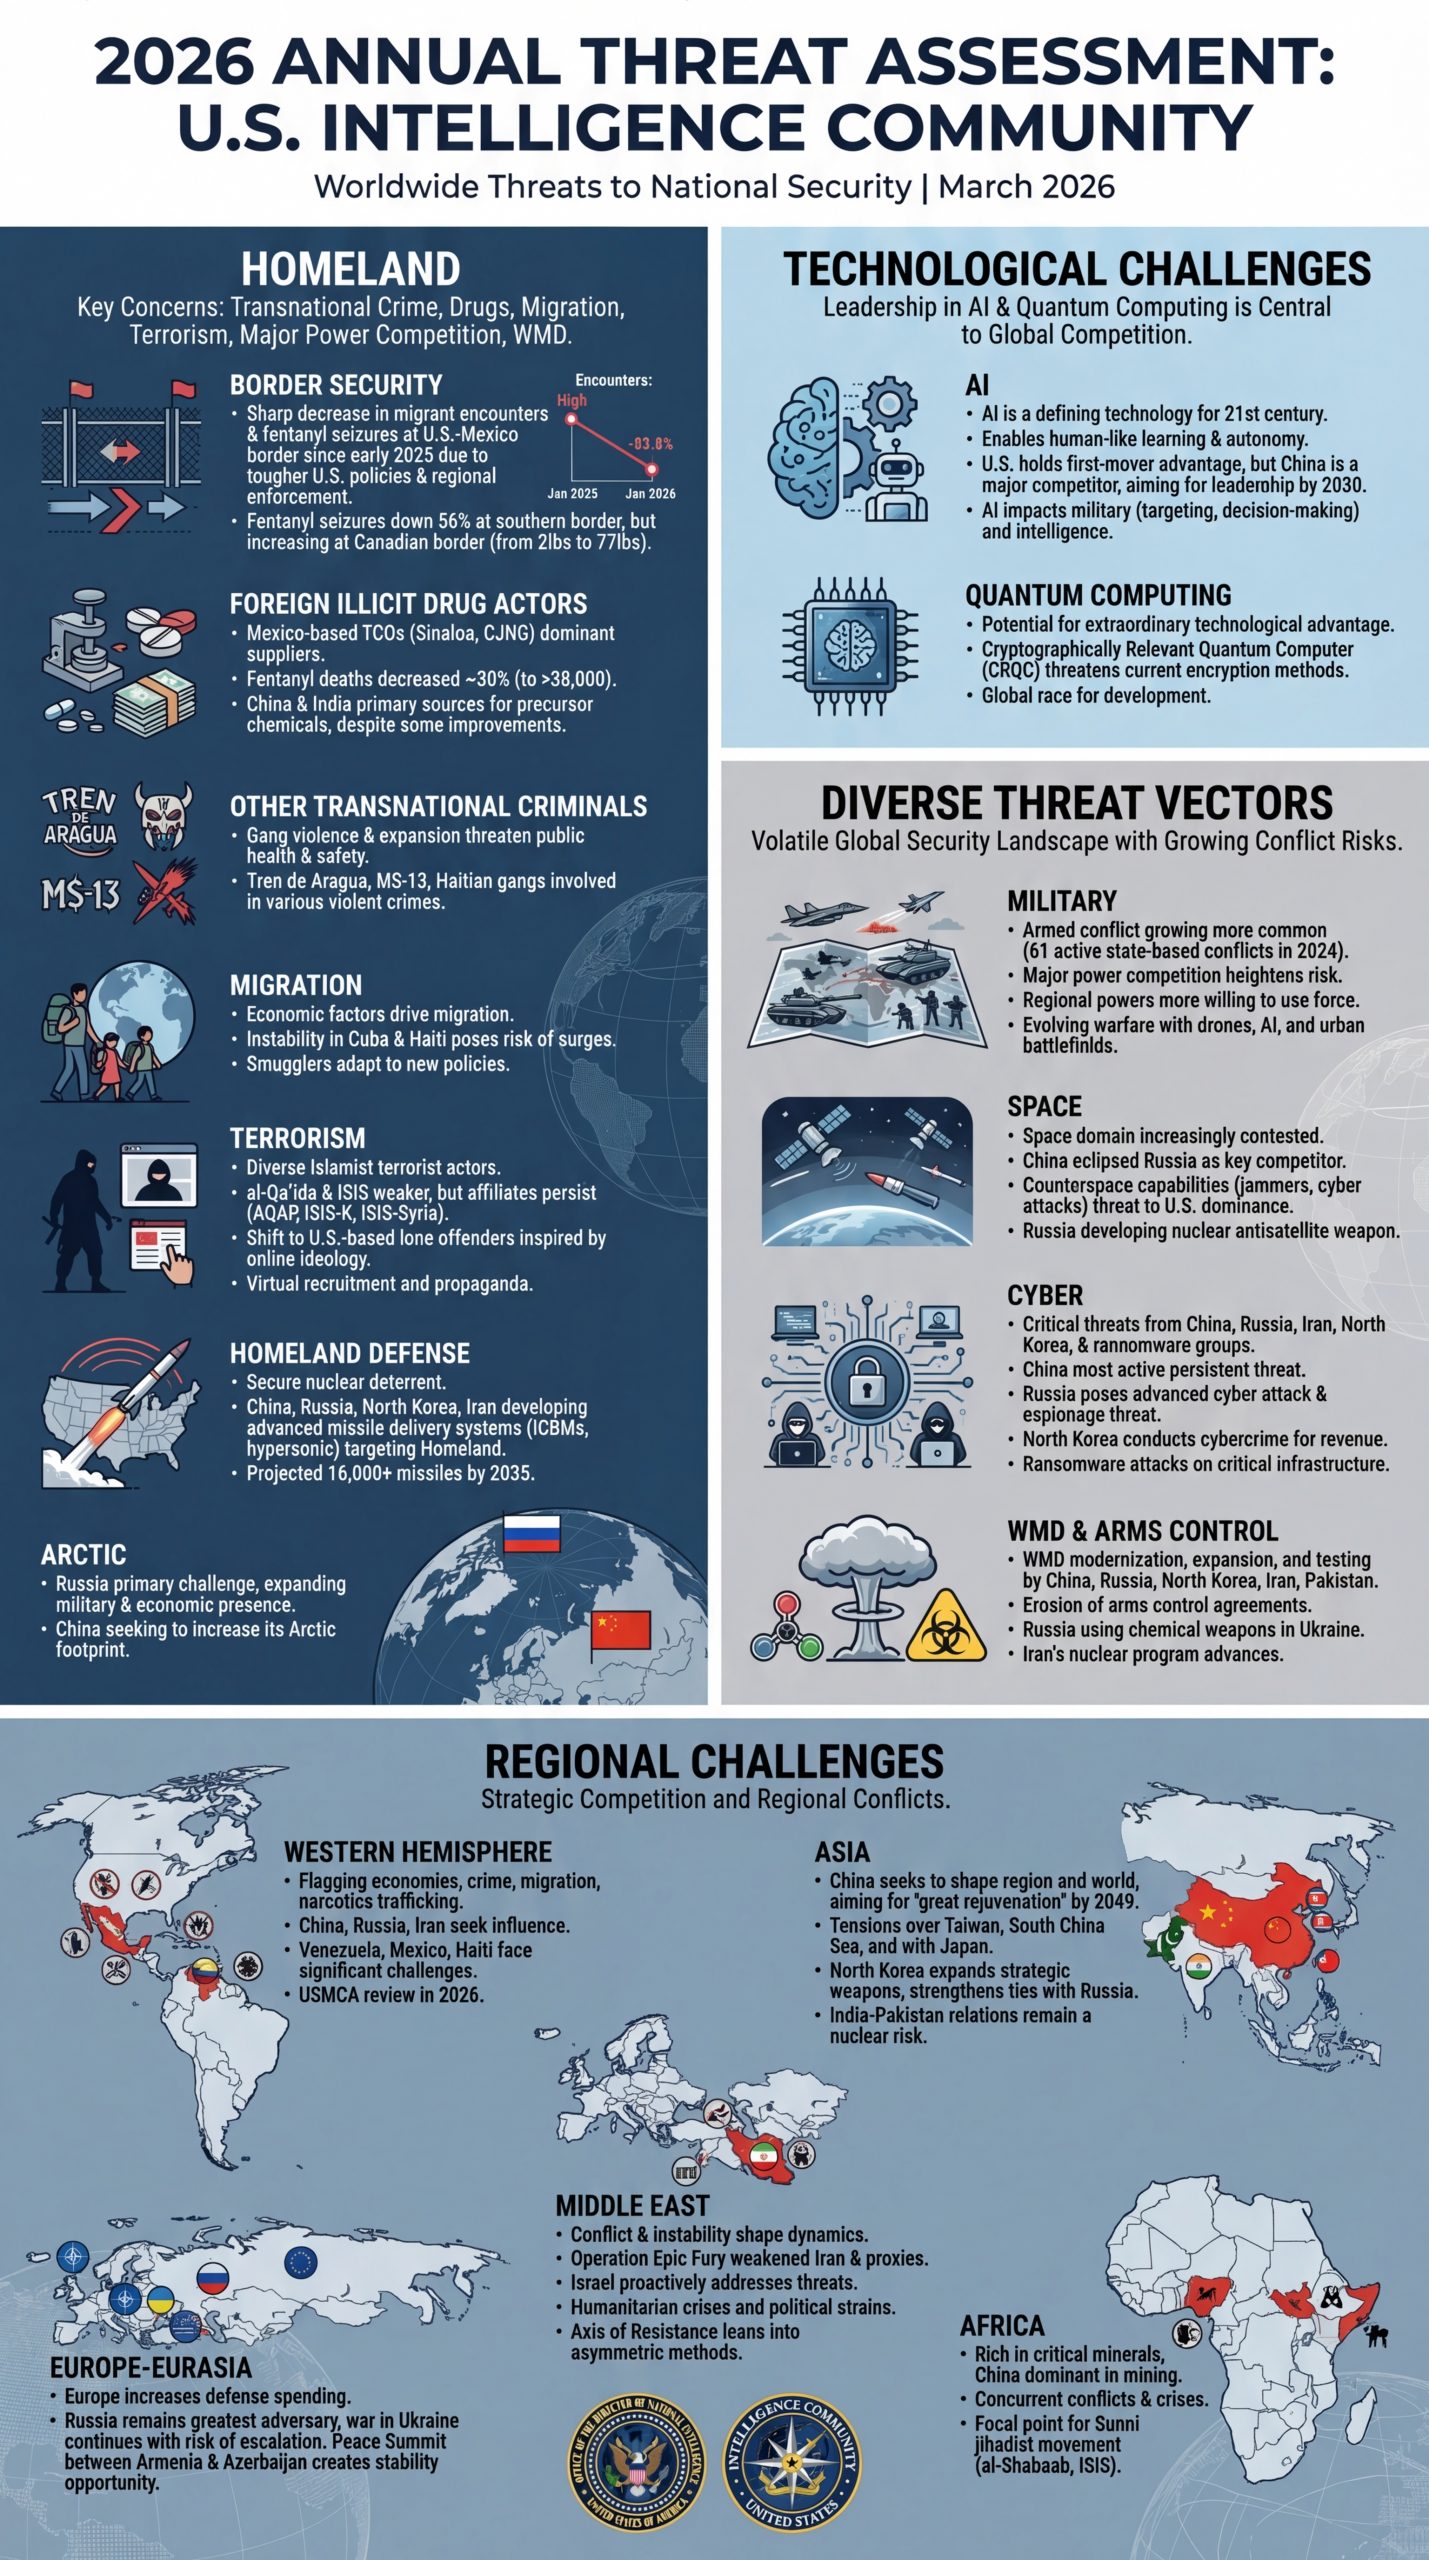
Create a large illustrated explainer poster designed to be printed on a large-format poster printer and hung up on the wall that narrates the attached briefing as a single large poster that can be printed and hung on a wall that outlines all of the core details. It should cover all of its key details.
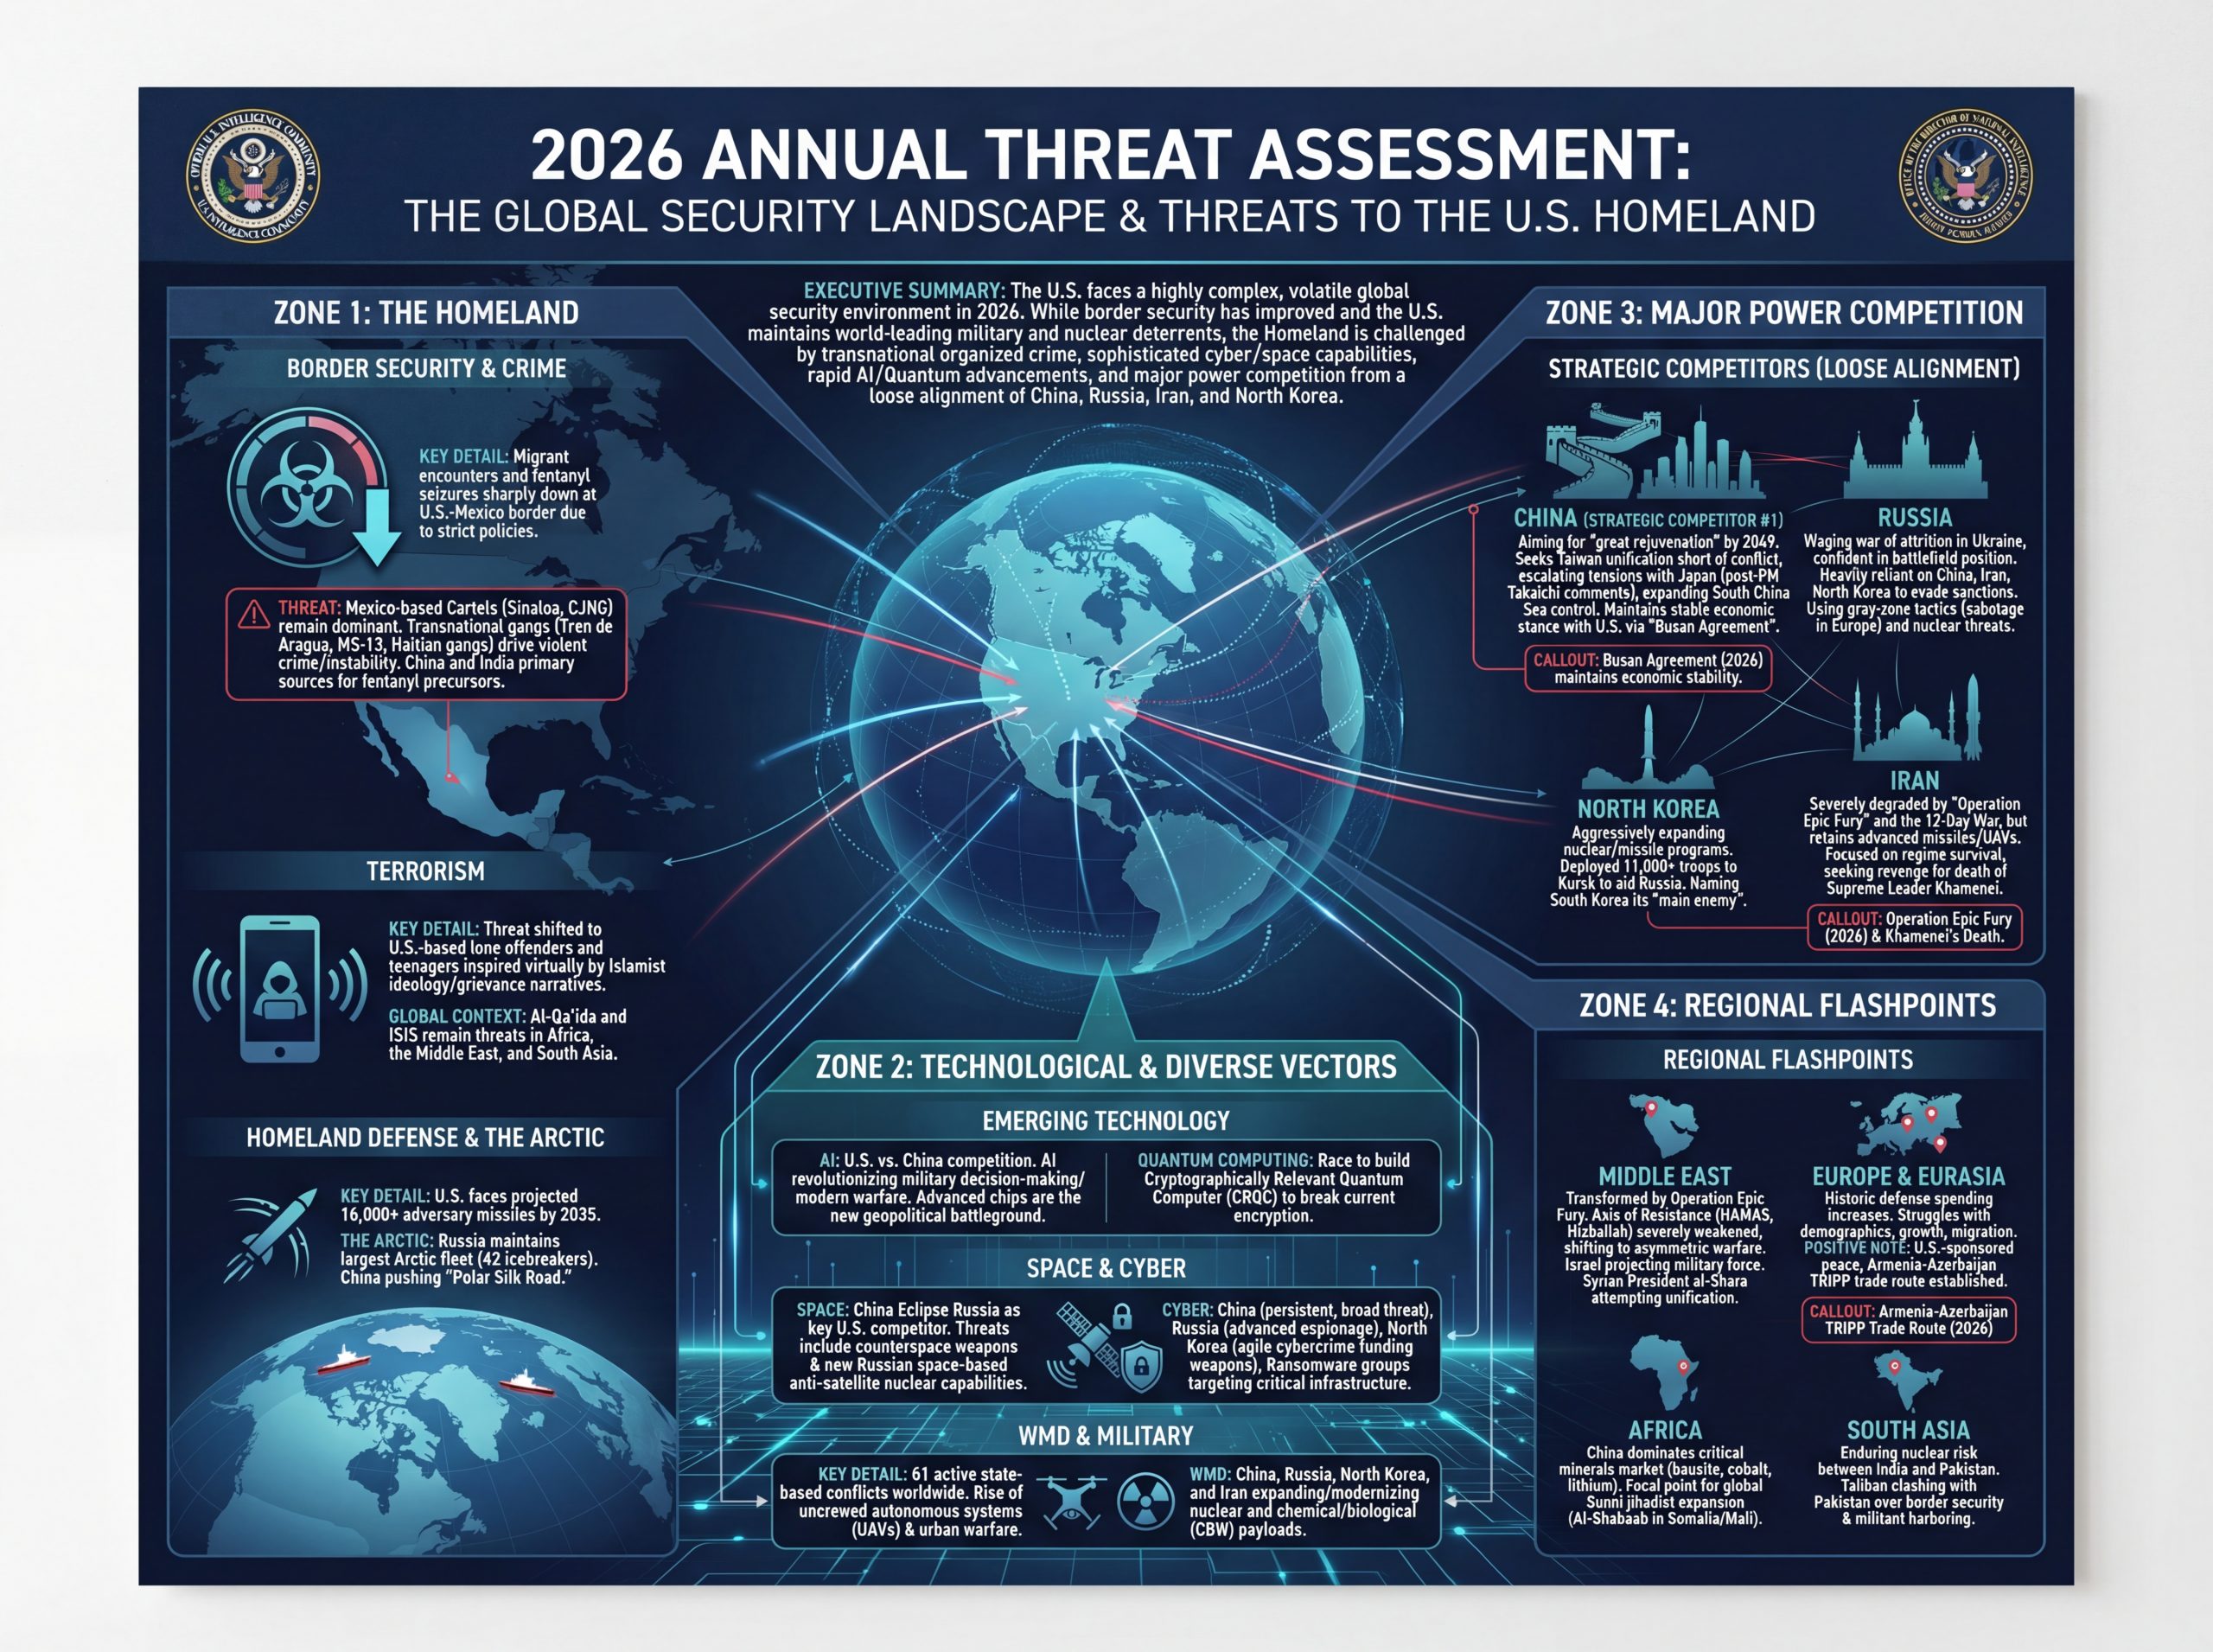
And we'll repeat the same with Nano Banana 2 at 4K and High Thinking Level: