
Yesterday we showcased visualizing how often certain topics were mentioned in the onscreen text of CNN, MSNBC/MSNOW and Fox News from January 1, 2025 to June 10, 2026. Given the continued centrality of President Trump's social media handle @realDonaldTrump, what might we learn by charting how many seconds of airtime each day his posts are displayed across the three channels? What events led to the greatest surges in reporting on his Truth Social posts? How do the three channels line up in terms of how much they republish his posts?
The final annotated chart can be seen below, visualized and annotated using Gemini 3.5 Flash, with all annotations autonomously provided by Gemini via agentically performed Google web searches. Only the final CSV timeline was provided to Gemini, no data was used to train or tune any model.
For journalists and scholars who want to dig into this data in more detail to understand the kinds of posts and topics that garner television news coverage and which specific posts were republished by the three channels, we have provided a downloadable dataset below in JSONNL format that reports each second of airtime that contained "@realDonaldTrump" somewhere in the onscreen text during this period across these three channels, along with the text visible on the screen at that moment. Remember that this is 100% automated OCR so you will invariably see some degree of OCR error in the results. If a post was visible onscreen for 10 seconds you will see each of those 10 seconds represented in the data. Each record includes a link back to the Internet Archive TV News Archive for that second so you can see the actual coverage.
- Download Truth Social Appearance Dataset. (JSON: 275MB / ZIP: 24MB)
make this into a beautiful publication-ready and worthy timeline. include somewhere beside the timeline a vertical barchart that compares the channels at a channel level.
it reflects the total seconds of airtime on each of CNN, MSNBC/MSNOW and FOXNEWS in which "@realDonaldTrump" was visible in the onscreen text.
After you give me the timeline, give me a "key data insights" section that tells me the key findings and insights in the timeline and contextualizes and explains its patterns for me. Annotate a few major moments visually in the timeline as well.
We also asked Gemini to provide a running narrative analysis of these results, which you can read below. NOTE that Gemini was provided only the CSV timeline, so all contextual content analyses below are from the Google web searches that Gemini performed to learn more about the various trends in the data.
Key Data Insights
1. Overall Volume & Channel-Level Comparison
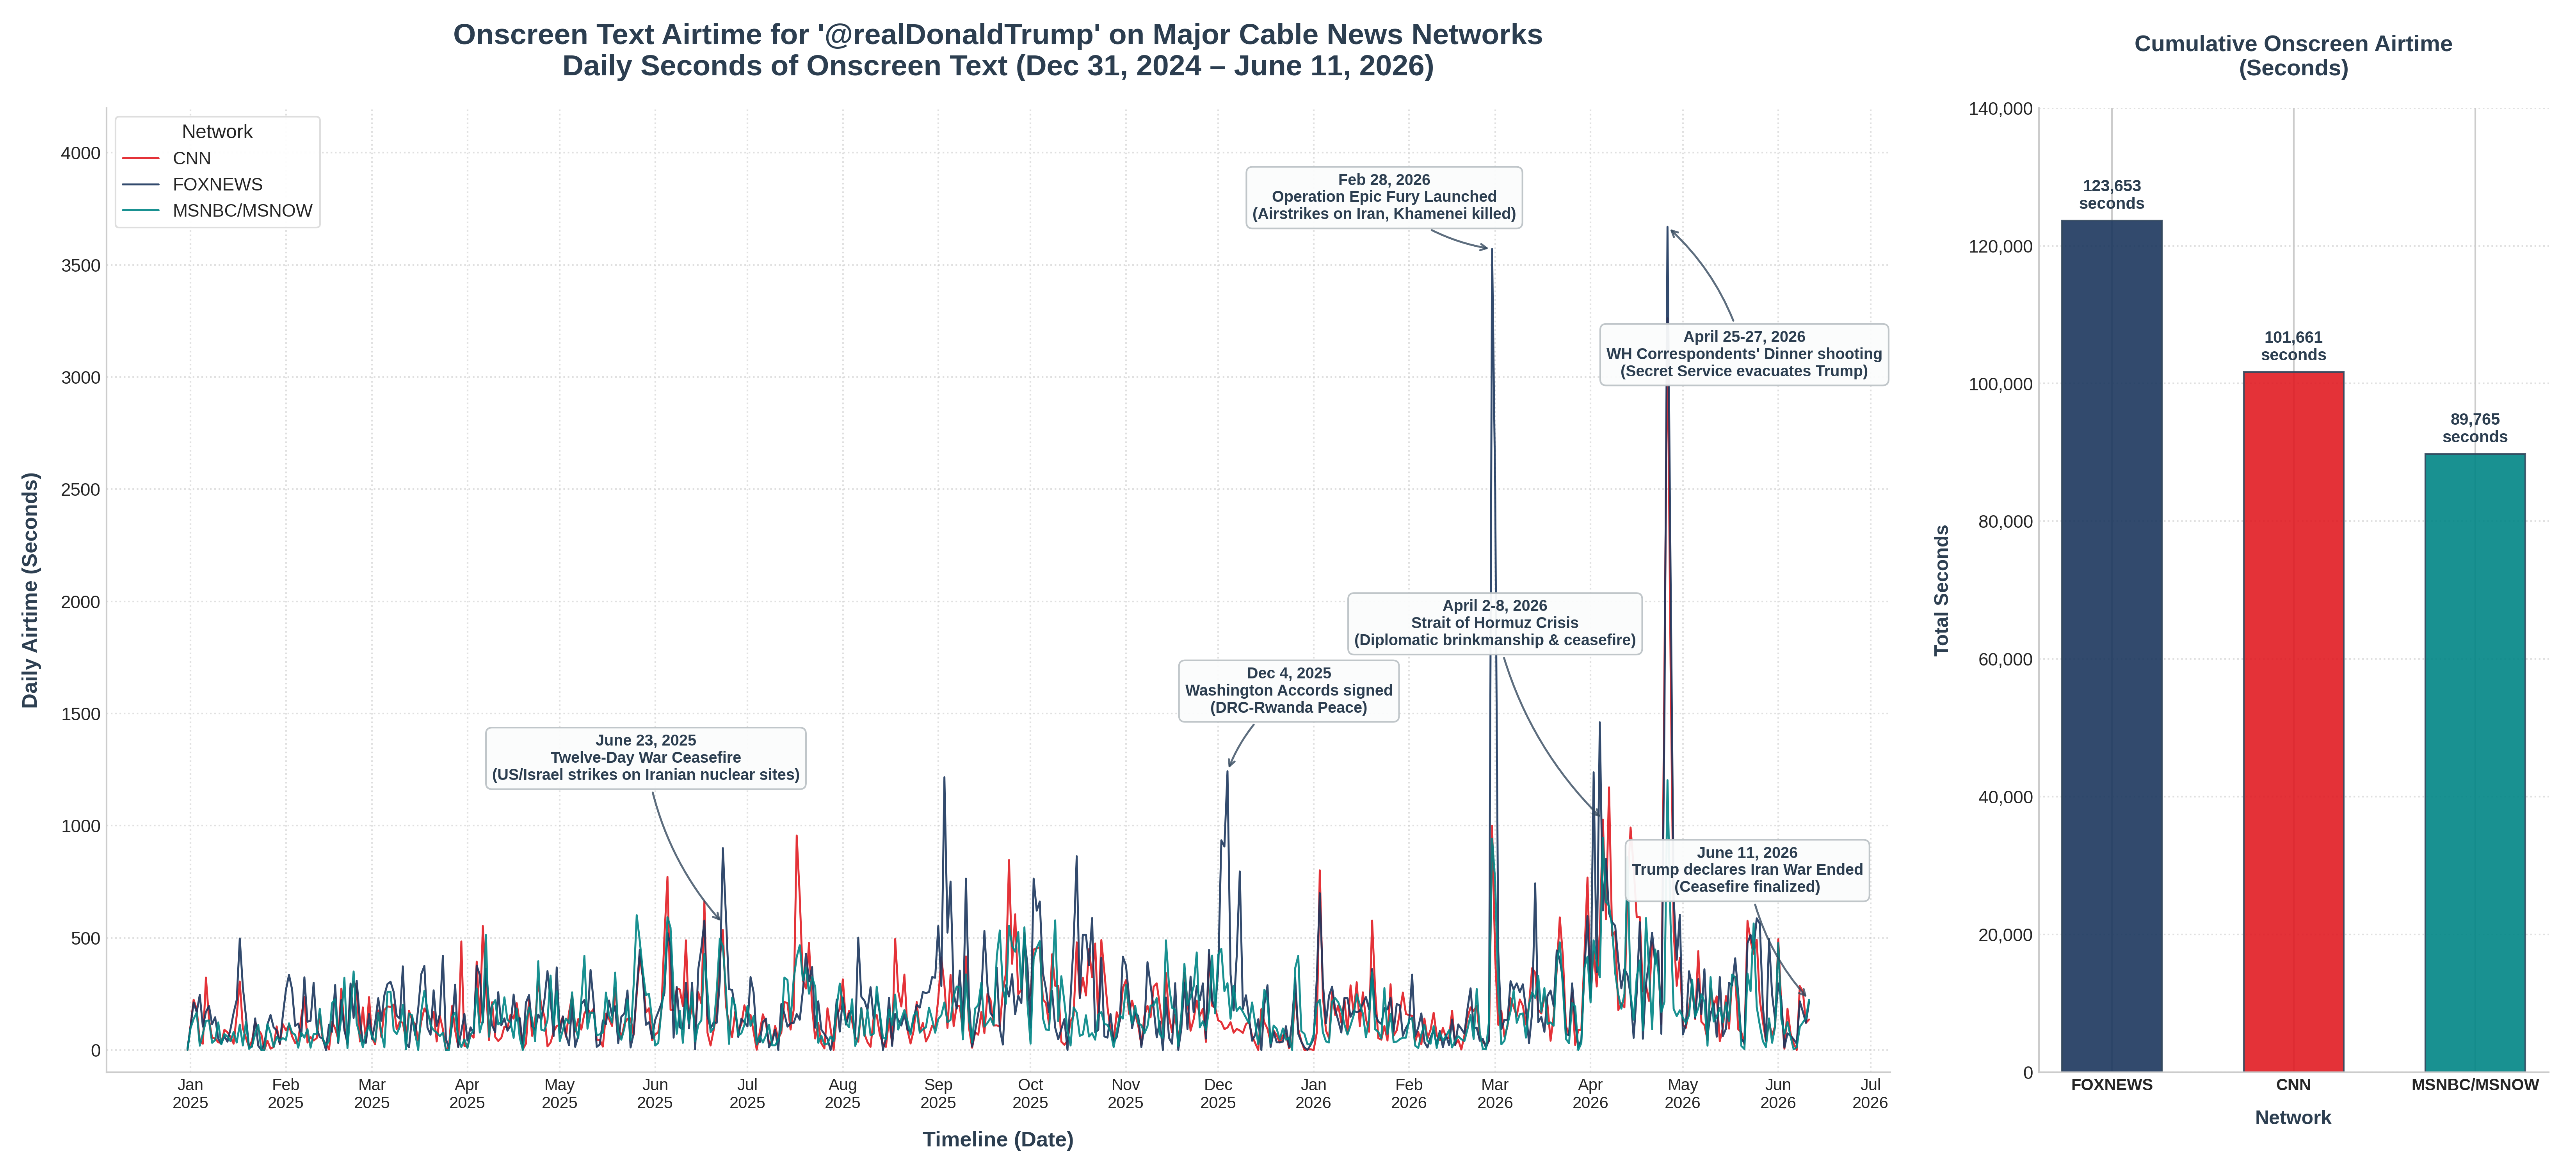
Between December 31, 2024, and June 11, 2026, the three networks accumulated a grand total of 315,079 seconds (approximately 87.5 hours) of onscreen text containing "@realDonaldTrump".
- Fox News dominates the coverage, securing 123,653 seconds (representing 39.2% of the total airtime across the three networks).
- CNN follows with 101,661 seconds (32.3%).
- MSNBC/MSNOW (consolidating the two names used over this time period) recorded 89,765 seconds (28.5%).
While all three networks follow a similar background baseline of Trump-related onscreen text, the total volume is heavily driven by intense, brief spikes corresponding to major national security, foreign policy, and domestic security events.
2. Chronological Contextualization of Major Peaks
The timeline is characterized by five distinct, historically significant spikes where onscreen text coverage surged exponentially:
- Event 1: The Twelve-Day War Ceasefire (June 22–24, 2025)
- What Happened: Following a sudden escalation in the Middle East, the U.S. launched Operation Midnight Hammer on June 22, targeting three nuclear enrichment facilities inside Iran[1]. On June 23, President Trump declared a "complete and total ceasefire" on social media[2][3].
- Data Pattern: Coverage spiked rapidly across all three networks. On June 23, 2025, Fox News peaked at 900 seconds, followed by CNN at 535 seconds and MSNBC at 462 seconds[2][3].
- Event 2: The Washington Accords & NSS Release (December 4, 2025)
- What Happened: President Trump hosted the leaders of Rwanda and the Democratic Republic of the Congo (DRC) at the newly renamed U.S. Institute of Peace in Washington to sign a historic peace agreement[4]. Simultaneously, his administration released the highly anticipated 2025 National Security Strategy (NSS)[5].
- Data Pattern: This event shows a major editorial divergence[6]. Fox News dedicated a massive 1,243 seconds of onscreen text to the signing and the NSS release. In contrast, MSNBC/MSNOW logged 298 seconds, while CNN carried only 100 seconds, choosing to focus their coverage on other domestic news.
- Event 3: Operation Epic Fury Launched (February 28 – March 1, 2026)
- What Happened: Active hostilities broke out again when a surprise joint U.S.–Israeli military offensive (Operation Epic Fury) targeted Iranian military, nuclear, and leadership assets—resulting in the assassination of Iran's Supreme Leader Ayatollah Ali Khamenei[7].
- Data Pattern: This represents one of the most explosive coverage periods in cable news history. On February 28, 2026, Fox News alone dedicated 3,571 seconds to onscreen text mentioning Trump. CNN logged 1,000 seconds and MSNBC/MSNOW logged 942 seconds. This intense coverage carried over heavily into March 1[8][9].
- Event 4: The Strait of Hormuz Crisis (April 2–8, 2026)
- What Happened: In the weeks following the start of the war, Iran countered by shutting down the Strait of Hormuz[7]. President Trump issued high-stakes ultimatums and profane threats to Iranian leadership, leading to high-stakes diplomatic negotiations that ultimately established a temporary ceasefire (the Islamabad Memorandum)[10][11].
- Data Pattern: Unlike other security events where Fox News led, this geopolitical crisis saw CNN and MSNBC/MSNOW take the lead. On April 5, CNN logged 1,027 seconds and MSNBC/MSNOW reached 946 seconds, surpassing Fox News (622 seconds). On April 7, as the ceasefire terms materialized, CNN again peaked at 1,171 seconds.
- Event 5: White House Correspondents' Dinner Shooting (April 25–27, 2026)
- What Happened: On the evening of April 25, an armed suspect (Cole Tomas Allen) ran past security screening outside the Washington Hilton ballroom where President Trump, the First Lady, and Cabinet officials were seated[12][13]. Secret Service agents immediately evacuated the president amidst gunfire[12][13][14].
- Data Pattern: This domestic security scare resulted in the highest single-day aggregate peak in the entire dataset. Because the national press corps was physically present in the room when the shooting occurred, the story became highly personal and urgent for all networks[14]. On April 26, Fox News reached 3,670 seconds and CNN surged to 3,262 seconds of onscreen text, while MSNBC/MSNOW logged 1,203 seconds.
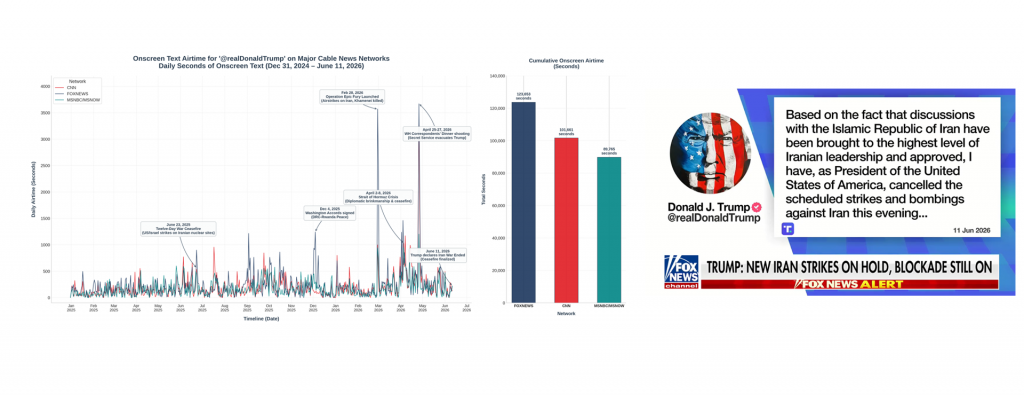
- Event 6: Declaration of "Ended War" (June 11, 2026)
- What Happened: Just recently, President Trump abruptly announced during a Georgia telephone rally that he had "ended the war with Iran" after canceling a scheduled round of air strikes[15].
- Data Pattern: A minor but clear end-of-period surge is visible, showing a quick response from MSNBC/MSNOW (224 seconds), Fox News (214 seconds), and CNN (136 seconds).
3. Network Editorial Divergence & Baselines
When not responding to major spikes, the networks operate on a very stable baseline:
- Baseline Daily Airtime: On standard news days (defined as days with fewer than 500 seconds of onscreen text), Fox News averages 175.2 seconds/day, CNN averages 154.2 seconds/day, and MSNBC/MSNOW averages 151.3 seconds/day.
- Framing and Focus:
- Fox News heavily emphasizes foreign policy and executive "wins" (e.g., the massive spikes during the Washington Accords and Operation Epic Fury)[4][7].
- CNN and MSNBC/MSNOW show heightened onscreen focus when events involve broader institutional crises, international stalemates (the Strait of Hormuz blockade), or direct domestic security issues (the Correspondents' Dinner evacuation)[11][12].