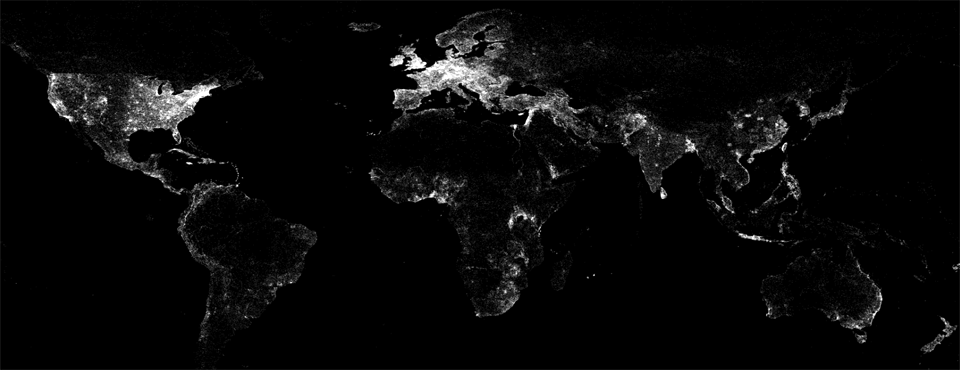
We're excited to unveil a new visualization that showcases the incredible reach of GDELT 2.0. The map below displays a dot at every location mentioned one or more times in the GDELT 2.0 Global Knowledge Graph from February 19, 2015 through July 11, 2015. Dots are not sized by the number of mentions, so a dot could represent a single mention or tens of millions of mentions. Notice how even in the absence of country borders, you can make out the continental contours in sharp relief, while locations with few human inhabitants, like the Sahara Desert, are clearly visible. As you zoom further into the map, notice how even the most remote regions are still covered with a blanket of dots closely corresponding to population density, illustrating the enormous power of GDELT's focus on local media and mass machine translation. Over 707,000 distinct locations on Earth are visible on the map below, rounded to the nearest two decimal places, yielding just over 492,000 points.
Alternatively, here is a lower-resolution version that is more print-friendly, rendered using CartoDB. It displays the same data as above, but rounds all points to one decimal place instead of two and offers a version that can more easily be printed and displayed as a static image.
Technical Details
For those interested in creating their own version of this map, the procedure is actually quite simple. The following SQL query, drawn from the BigQuery + GKG 2.0 sample queries guide, searches the GKG 2.0 table in Google BigQuery, parsing the V2Locations field and rounding each coordinate to the nearest two decimals (the grey/blue map was rounded to one decimal):
SELECT lat, long, COUNT(*) as numarticles
FROM (
select
ROUND(FLOAT(REGEXP_EXTRACT(SPLIT(V2Locations,';'),r'^[2-5]#.*?#.*?#.*?#.*?#(.*?)#.*?#')), 2) as lat,
ROUND(FLOAT(REGEXP_EXTRACT(SPLIT(V2Locations,';'),r'^[2-5]#.*?#.*?#.*?#.*?#.*?#(.*?)#')), 2) as long
from [gdelt-bq:gdeltv2.gkg]
)
where lat is not null and long is not null
group by lat,long
Save the results to a new export table in BigQuery (it should only take around 18 seconds to complete!), export as a CSV file to Google Cloud Storage, and then download to your local computer. For the blue/grey map, upload to CartoDB and map! For the black/white map, read on.
Download the latest version of the free open source GraphViz package. Then download the bqcsvtomap.pl PERL script and run on the downloaded file like "./bqcsvtpomap.pl DOWNLOADEDCSVFILE.CSV". The PERL script reprojects from plate carree to GraphViz' coordinate space, generates a .DOT GraphViz file, and then uses the GraphViz rasterizer to generate the final map file. It may take a fair amount of RAM and processing time to generate the final visualization, but after a few minutes you should have a final map like the one above, measuring 12,288 by 6,144 pixels.
The final map is too large for many web browsers to display properly, so you might want to create a tiled version of it that can be interactively panned/zoomed in a web browser in an interface similar to what Google Maps uses. To do this we need to run a special package that takes the image and chops it up into a collection of pyramidal tiles. First, download the free open source GDAL package. On a debian system the following commands install all of the necessary libraries (some of these may be beyond what you need):
apt-get install python2.7 python2.7-dev python-pip
apt-get install libgdal-dev
apt-get install gdal-bin python-gdal
pip install pillow
Next, download the customized "gdal2tiles-leaflet" package that generates tiles in a Leaflet optimized layout. Specifically, download the "gdal2tiles-multiprocess.py" script.
Then, examine the dimensions of your map from above and determine the length of its longest side in pixels. In the case of the map above, its width is 12,288 pixels, which is longer than its height of 6,144, so the longest side in pixels is 12,288. Plug that number into the equation below and run via a standard UNIX shell:
echo "l(12288/256)/l(2)" | bc -l
The output of the equation above tells us the maximum number of zoom levels we will need to create for our image. Usually the output will be a fractional number, so round it up to the nearest integer. In the case of above, it will return "5.58496250072115618150", which you should thus round up to 6. Then, we need to run the script from above that actually generates the tiles. Substitute the "6" in the "0-6" below with whatever rounded up number you got from the equation above. Run the command as:
./gdal2tiles-multiprocess.py -l -p raster -z 0-7 -w none FILENAMEOFYOURMAP.PNG TileCache
This command may take several minutes to complete. It is using all of the processors on your computer to resize the image into different zoom levels and then chop each zoom level into tiles. Running on a 16 core Google Compute Engine instance with a SSD persistent disk, it took just a few seconds.
Finally, upload your tile directory to your web server. If you are using Google Cloud Storage, you could use a command like the following:
gsutil -m cp -r TileCache gs://yourcloudstorage/somedirectory/
As the last step, download this HTML template and rename to "index.html". Open it in a text editor and change both of the "Your Map Title Goes Here" instances (one at the top and one towards the middle of the HTML) to the title of your map, change the URL "http://websitegoeshere/yourdirectorygoeshere/" to the URL on your website where you uploaded the "TileCache" subdirectory to (leave the "/TileCache/{z}/{x}/{y}.png" part on the end of the URL). Change the "6" in "maxZoom: 6" to whatever rounded up number you got from the equation earlier. Finally, upload this HTML page to your web server! Congratulations, you should now have an interactive zoomable map like above!
