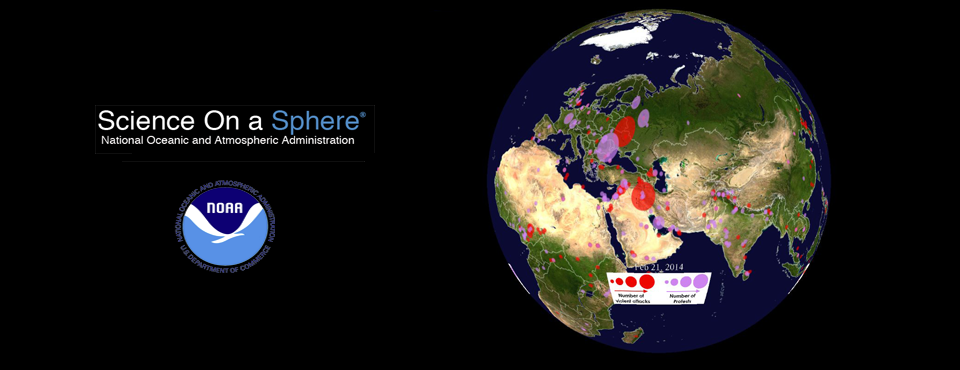
Now imagine a map of human society itself displayed on this globe, pinpointing every protest and incidence of violence against a civilian worldwide on a daily basis from January 1, 1979 to present, updating every day and animating right in front of you! Amazingly, this is now reality!
We are enormously excited to announce that GDELT is now available as a NOAA Science on a Sphere dataset and can be viewed in most SOS exhibits around the world (some installations only display select topically-focused datasets). For the first time you can actually watch global human society itself play out in front of your eyes! You can see waves of protests turn into violence, watch as unrest spreads as a flood across a region or extinguishes as quickly as it happened. You can observe major turning points in world history or isolated events that received little attention outside the rural village where they happened. Visualize 35 years of human history or focus on the latest global events with daily updates.
GDELT allows visitors to Science on a Sphere exhibits to see a daily snapshot of human society as seen through the eyes of the world’s news media. Pulling up the GDELT dataset on an SOS sphere, you see an animation of all worldwide protests (pink/purple) and violence against civilians (red) by day from January 1, 1979 to present. The animation is updated each morning with the previous day’s events, meaning you are seeing a world in constant motion. We’re particularly excited by the ability of these daily updates to make the world’s news “come alive.”
While it can’t begin to compare with seeing it on a physical globe floating in front of you, the following YouTube video shows the full animation sequence through April 25, 2014:
To create the GDELT SOS visualization, we used Google BigQuery to compile a daily histogram of every location with a protest or some form of violence against civilians. Just a few seconds later BigQuery delivered our list, which we then rendered into map form using GraphViz using the same system we previously used to visualize the history of world as seen through the eyes of Wikipedia. We repeat this process each morning to generate the daily updates. Try running your own queries using GDELT in BigQuery.
Due to popular demand, each morning we also take the map layers we create for the Science on a Sphere dataset and create a static web-friendly map. Now you can embed a world map of all protests and violence against civilians, updated daily, into your own website! Just embed the following URL as an image in your webpage:
http://data.gdeltproject.org/dailymaps_noaasos/GDELT-ProtestsViolence-TODAY.png
That’s all there is to it! That URL will update each day somewhere around 4-6AM EST and reflect all events that occurred the preceding day!
So, embed a map of the world’s events in your own website using the link above, explore GDELT yourself using Google BigQuery, and find the Science on a Sphere exhibit nearest you to experience the full effect in person! If you’ve never seen a 6-foot-diameter physical globe floating in thin air before your very eyes, displaying a map of everything that’s happened around the world over the last 35 years day-by-day, you’re not going to believe your eyes!
The NOAA Science On a Sphere display is truly a breathtaking experience and we are so excited to be able to bring GDELT to museums across the world, to bring the world’s news to life, to offer the first societal-scale glimpses of a world in motion.
