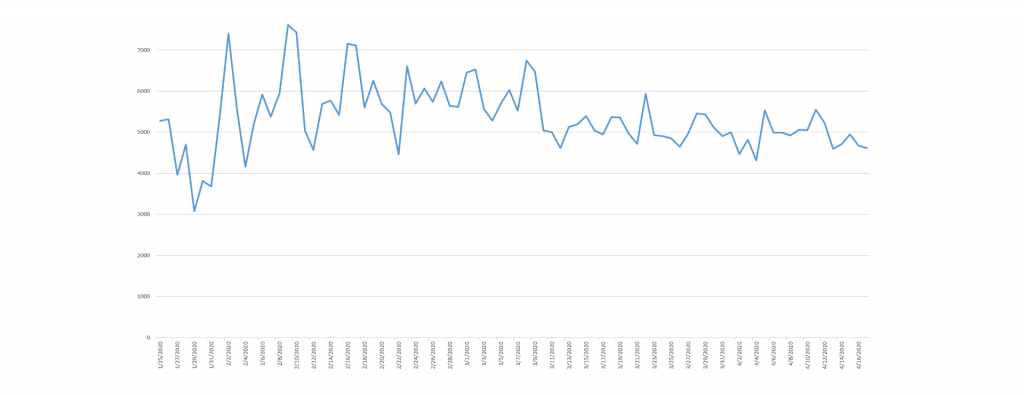
One of the metrics we track in the Visual Global Entity Graph (VGEG) 2.0 using Google's Cloud Video API to analyze CNN's television news programming in collaboration with the Internet Archive's Television News Archive is the number of speaker changes using speaker diarization. While imperfect, automated diarization offers an approximative window in how often speakers are switching during a broadcast, such as a back-and-forth exchange. Such speaker changes are more difficult to manage when speakers are physically remote and calling in via video conference, raising the possibility that speaker changes would be reduced during Covid-19.
Indeed, the timeline below shows the total number of speaker changes (not the number of distinct speakers – if two speakers switch back and forth, each switch will be counted below) observed each day on CNN via Google's speaker diarization.
March 10th appears to be the key date when CNN sharply reduced its speaker changes and also stabilized those daily counts, at around 5,000 changes per day.
TECHNICAL DETAILS
Computing the timeline above took just a single SQL query in BigQuery:
SELECT DATE(date) day, sum( numOCRChars ) ocrcount, sum( numSpeakerChanges ) speakercount, sum( numSpokenWords) totalwords, sum( numDistinctEntities) totalentities, sum( numDistinctPresenceEntities) totalpresenceentities FROM `gdelt-bq.gdeltv2.vgegv2_iatv` WHERE station='CNN' and DATE(date) >= "2020-01-25" group by day order by day asc
