
We're tremendously excited today to announce the new GDELT Stability Dashboard API! This new API service, created through the support of the PeaceTech Lab, is a live-updated embeddable timeline that you can drop into any website as a live browser-based visualization via an iframe or download and process yourself as a CSV file. Both embeddable visualization and CSV modes offer live 15 minute updates and offer a choice of a basic synthetic "instability" measure or average tone at the national and ADM1 levels, displayed as either a 15 minute timeline over the last 7 days or a day-level view over the last 180 days.
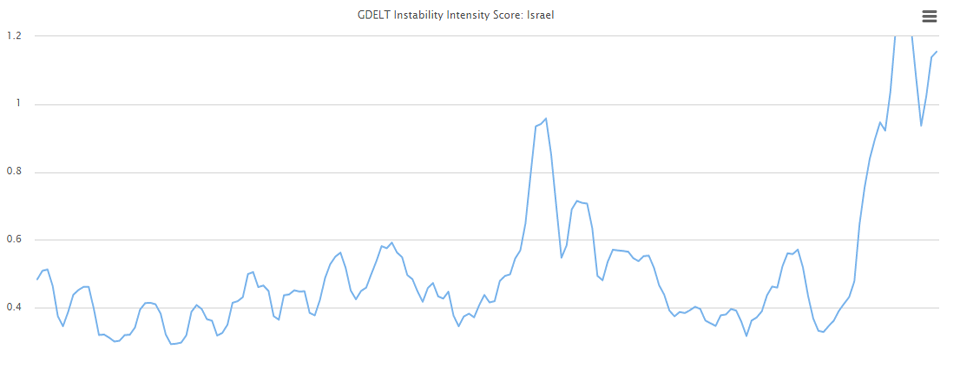
You can see an example of the embeddable timeline below, showing GDELT's assessed stability measure for Israel over the last 180 days, smoothed using a 5-day rolling average.
You can embed this timeline in your own website using a simple iframe via the HTML code below:
<iframe src="https://api.gdeltproject.org/api/v1/dash_stabilitytimeline/dash_stabilitytimeline?LOC=IS&VAR=instability&OUTPUT=viz&TIMERES=day&SMOOTH=5" width="100%" height="400"></iframe>
We'd like to thank the PeaceTech Lab for making this API possible and Google Ideas for their support of the GDELT Project.
OPTIONS
Below are all of the options that can be passed to the API. Add them to the root API URL of "https://api.gdeltproject.org/api/v1/dash_stabilitytimeline/dash_stabilitytimeline".
- LOC. This is the two-digit country code or four-digit ADM1 code for the location you wish to display data for. GDELT uses the adapted FIPS codes from GNS, you can use our quick lookup files for country codes and ADM1 codes. For example, to display data for Israel, you would use "LOC=IS". Note that for ADM1 codes, places with non-Latin characters may be missing characters due to the ASCII transcription we are presently using to ensure uniform compatibility with several libraries we are using for the API, but this will be upgraded shortly.
- VAR. This defines which variable should be displayed. The following options are currently supported:
- VAR=instability. This display a simple synthetic "instability" measure for a country offering a very basic, but insightful, view of the current level of conflict and instability involving it. Currently it is calculated by summing the total number of QuadClass=MaterialConflict and EventRootCode=14(Protest) events together and dividing by the total number of all events worldwide monitored by GDELT in the same time period. This yields a normalized view of instability.
- VAR=conflict. Same as above, but only includes QuadClass=MaterialConflict, ignoring protest events.
- VAR=protest. Same as above, but only includes EventRootCode=14, assessing only protest activity, but excluding all other kinds of conflict.
- VAR=tone. Average Standard GDELT Tone of all articles mentioning the location at least twice in the article within the given timeframe. This uses a very basic filter of requiring that an article mention the location at least twice anywhere in the article body, and assesses tone at the article level. Currently only the Standard GDELT Tone emotion is available, but in the future we hope to integrate the entire array of GCAM emotions. This variable can be especially insightful to spotting deteriorating situations where coverage of a country or area is turning increasingly negative, even if physical unrest has ceased or not yet begun.
- VAR=artvolnorm. This tallies the total number of articles mentioning the location at least twice anywhere in the article, divided by the total number of articles monitored by GDELT in the given timeframe, offering a normalized view of attention being paid to the location regardless of any physical unrest or other activity occurring there. This variable offers a useful measure of changes in overall global "attention" being paid to a given location.
- OUTPUT. This defines what kind of output should be produced. The following options are currently supported:
- OUTPUT=viz. This produces an embeddable interactive JavaScript visualization that can be embedded into any website via a simple iframe as seen in the example above.
- OUTPUT=csv. This produces a simple CSV output file that can be imported into any standard statistics package or parsed to create your own customized visualizations using a JavaScript toolkit like D3.
- TIMERES. This defines the time resolution shown on the graph. The following options are currently supported:
- TIMERES=15min. This displays data at GDELT's native update resolution of 15 minutes. All times are in the GMT timezone. The most recent 15 minutes are not shown. This option displays up to the last 7 days and updates every 15 minutes, making short-term realtime trends highly visible.
- TIMERES=day. This displays data at the daily level. The current day (in the GMT timezone) is not returned, since it would yield only a partial day. This option displays up to the last 180 days, making long-term trends visible.
- SMOOTH. This enables a rolling window average of 1-5 days. Enable it by setting "SMOOTH=5" to enable a 5-day rolling average, or any number up to 5. This is particularly useful for "TIMERES=15min" to smooth the inevitable noise of real world data and make large-scale trends more readily visible.
- NUMDAYS. This controls the number of days shown in the graph. For 15 minute resolution, up to the last 7 days are shown and for daily resolution, up to the last 180 days are shown. You can reduce this to a smaller window size to make trends more visually visibility.
- MODE. By default GDELT displays a single location at a time. You can set "LOC" to a country code and set "MODE=multi" to display all ADM1's within the country in parallel. This can be exceptionally useful for examining relative stability shifts across a country – see the examples section below.
- AUTOCAP. This option only affects the embeddable visualization (it is disabled for CSV output) and attempts to perform naive outlier detection, rezooming the graph to clip off outliers that would otherwise compress the rest of the graph and make trends impossible to see. This option should normally be left to its default state (enabled), but can be turned off if desired or in situations where there are high numbers of desirable outliers. Outliers will still appear on the graph and display their values when you mouse over them, but will be clipped out of the visual range. To turn it off, set "AUTOCAP=2".
EXAMPLES
- Israel's instability score over the last 180 days at the daily resolution, with 5 day smoothing:
- France's instability score over the last 180 days at the daily resolution, with 5 day smoothing:
- Average tone of coverage about Israel over the last 180 days at the daily resolution, with 5 day smoothing:
- Israel's instability score over the last 7 days at 15 minute resolution, with smoothing over a rolling window of the last five 15 minute intervals:
- Average tone of coverage about Israel over the last 7 days at 15 minute resolution, with smoothing over a rolling window of the last five 15 minute intervals:
- Normalized media attention about Israel over the last 180 days at daily resolution, with 5 day smoothing:
- Instability scores for all First Order Administrative Divisions (ADM1's) in Nigeria over the last 180 days at daily resolution and with no smoothing: