In an archive the size of the Internet Archive's Television News Archive, that spans tens of billions of seconds of airtime in 150+ languages across 300+ channels from 70+ countries over the past quarter-century, longitudinal and cross-channel/cross-national comparative analyses are complicated by the fact that channels have differing start and end dates, some are no longer monitored for years and then reactivated, and there are myriad total and partial outages of various durations that are different to each channel. Historically, this made it difficult to compare trendlines over time and across channels, since it wasn't clear whether the results were a legitimate reflection of coverage or merely a reflection of differing start/stop/outages. Today we are excited to announce the introduction of normalization "coverage status" annotations in which the start and stop dates of each channel and all periods of total or partial outages are optionally highlighted on the timeline graph to allow confirmation of the results (this can be turned off as desired). We are tremendously excited for the potential this offers for demanding data journalism and scholarly analyses of cross-national, cross-channel and longtitudinal coverage trends.
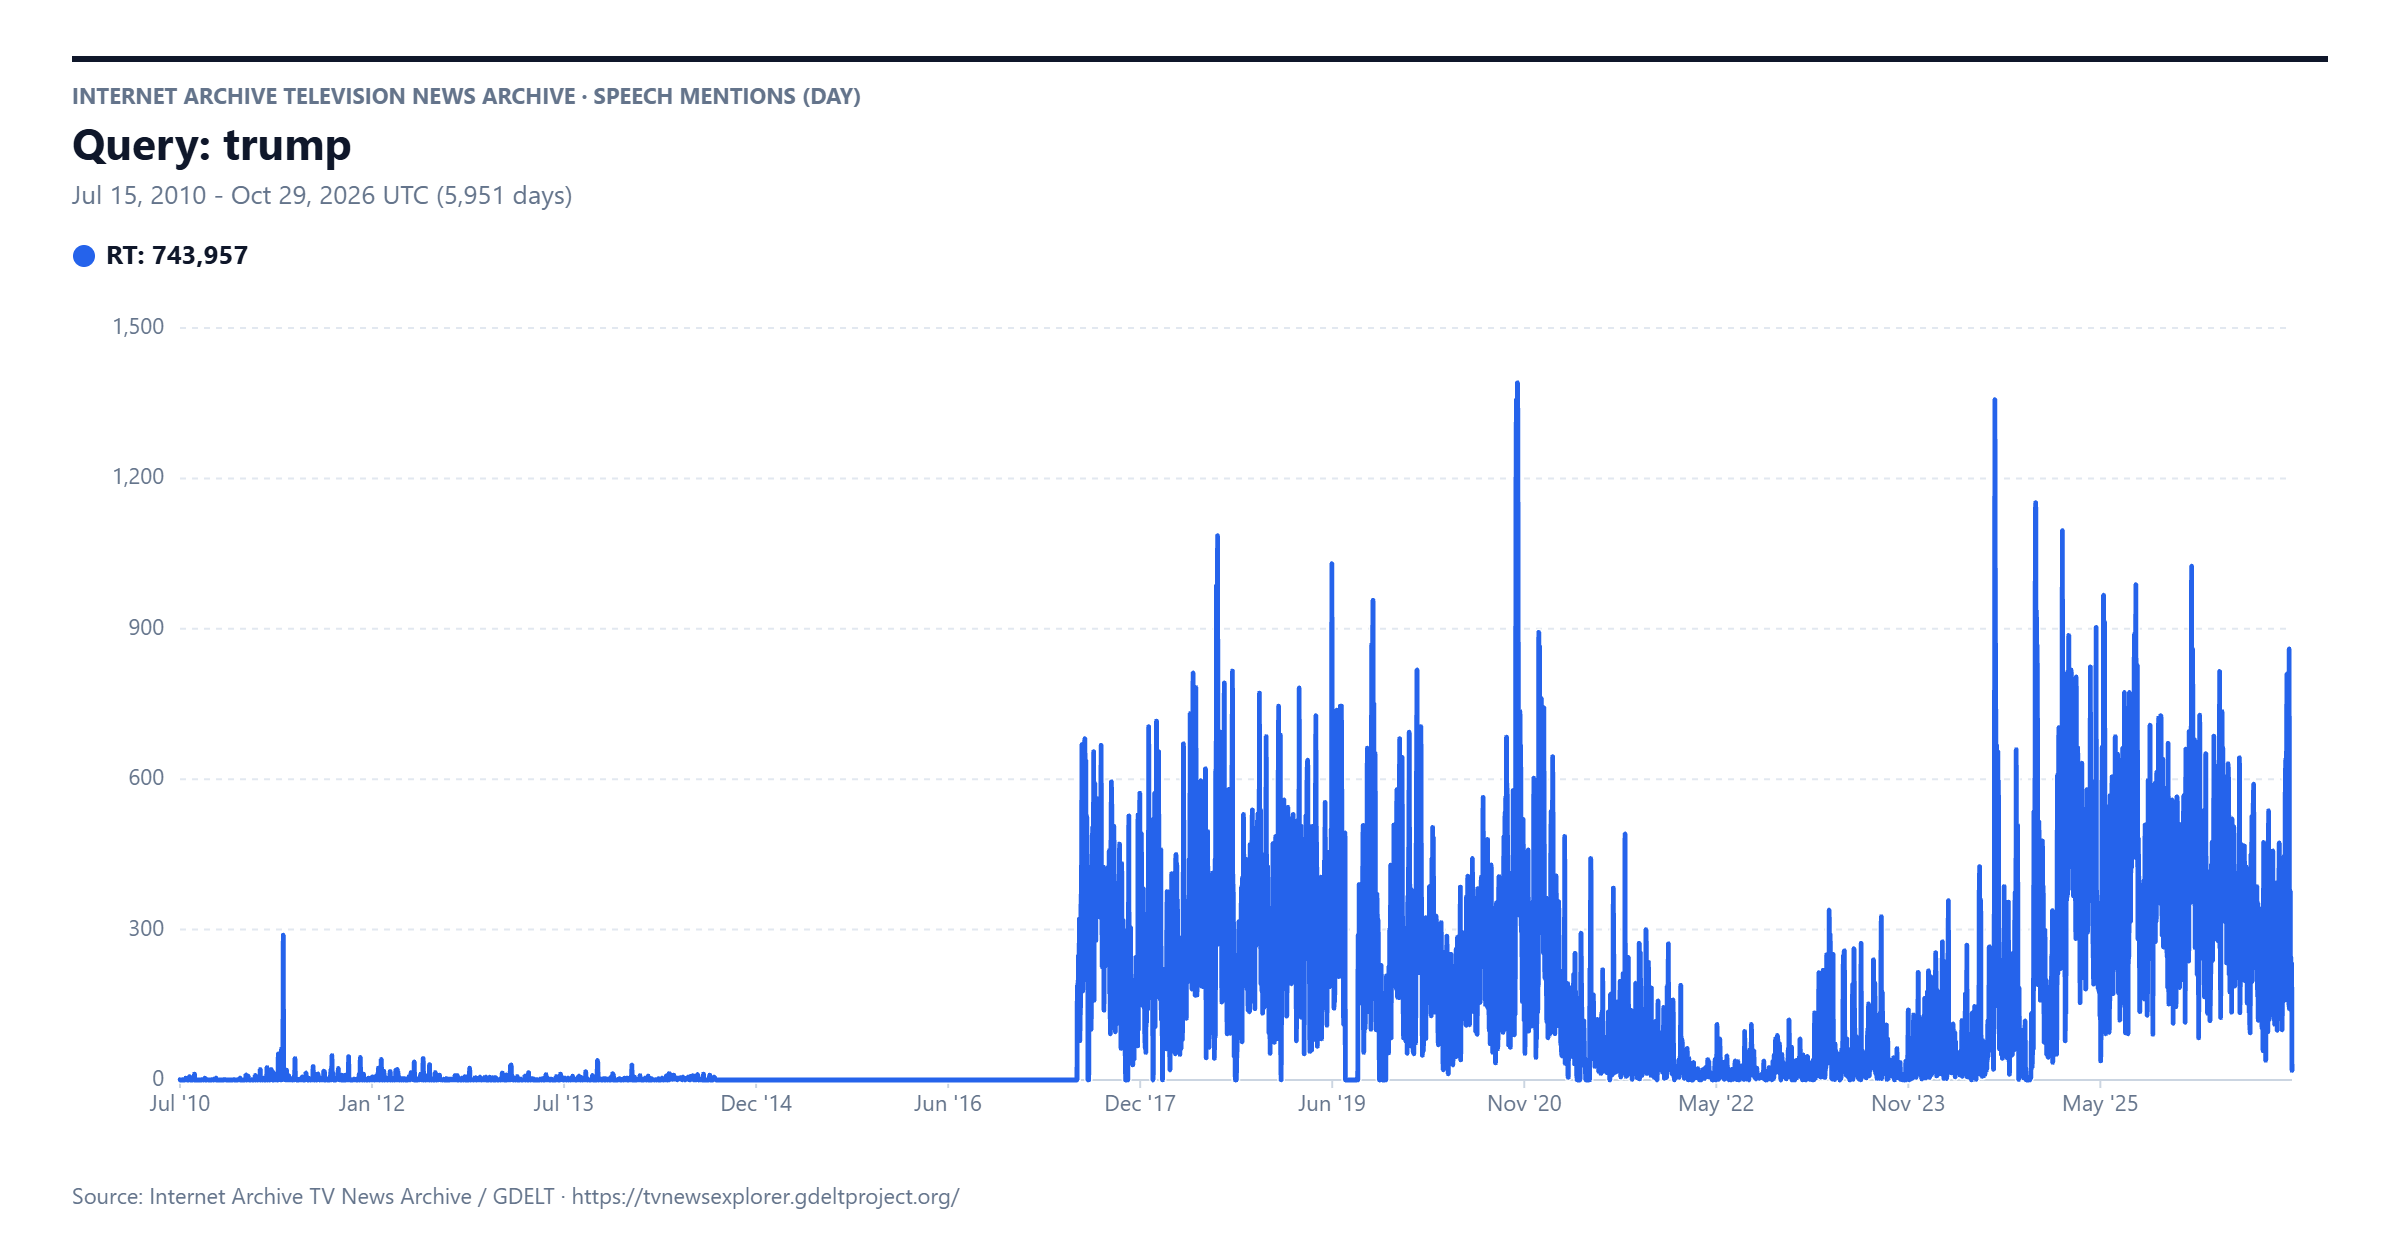
Let's trace mentions of "Trump" on Russia Today (RT) under the original timeline display. The TV News Archive began archiving RT in July 2010, but suffered a technical outage from August 2014 to June 2017 and several smaller outages, including a large portion of July-August 2019, in which no coverage was monitored. On the timeline below this manifests as few mentions of Trump from July 2010 and then a vertical surge on June 16, 2017 and several periods of zero mentions in the years since. Worse, is the sharp decline in mentions from mid-2021 to mid-2024 a legitimate pivot away from Trump by RT or does it represent a period with elevated technical errors and data loss in the archive?
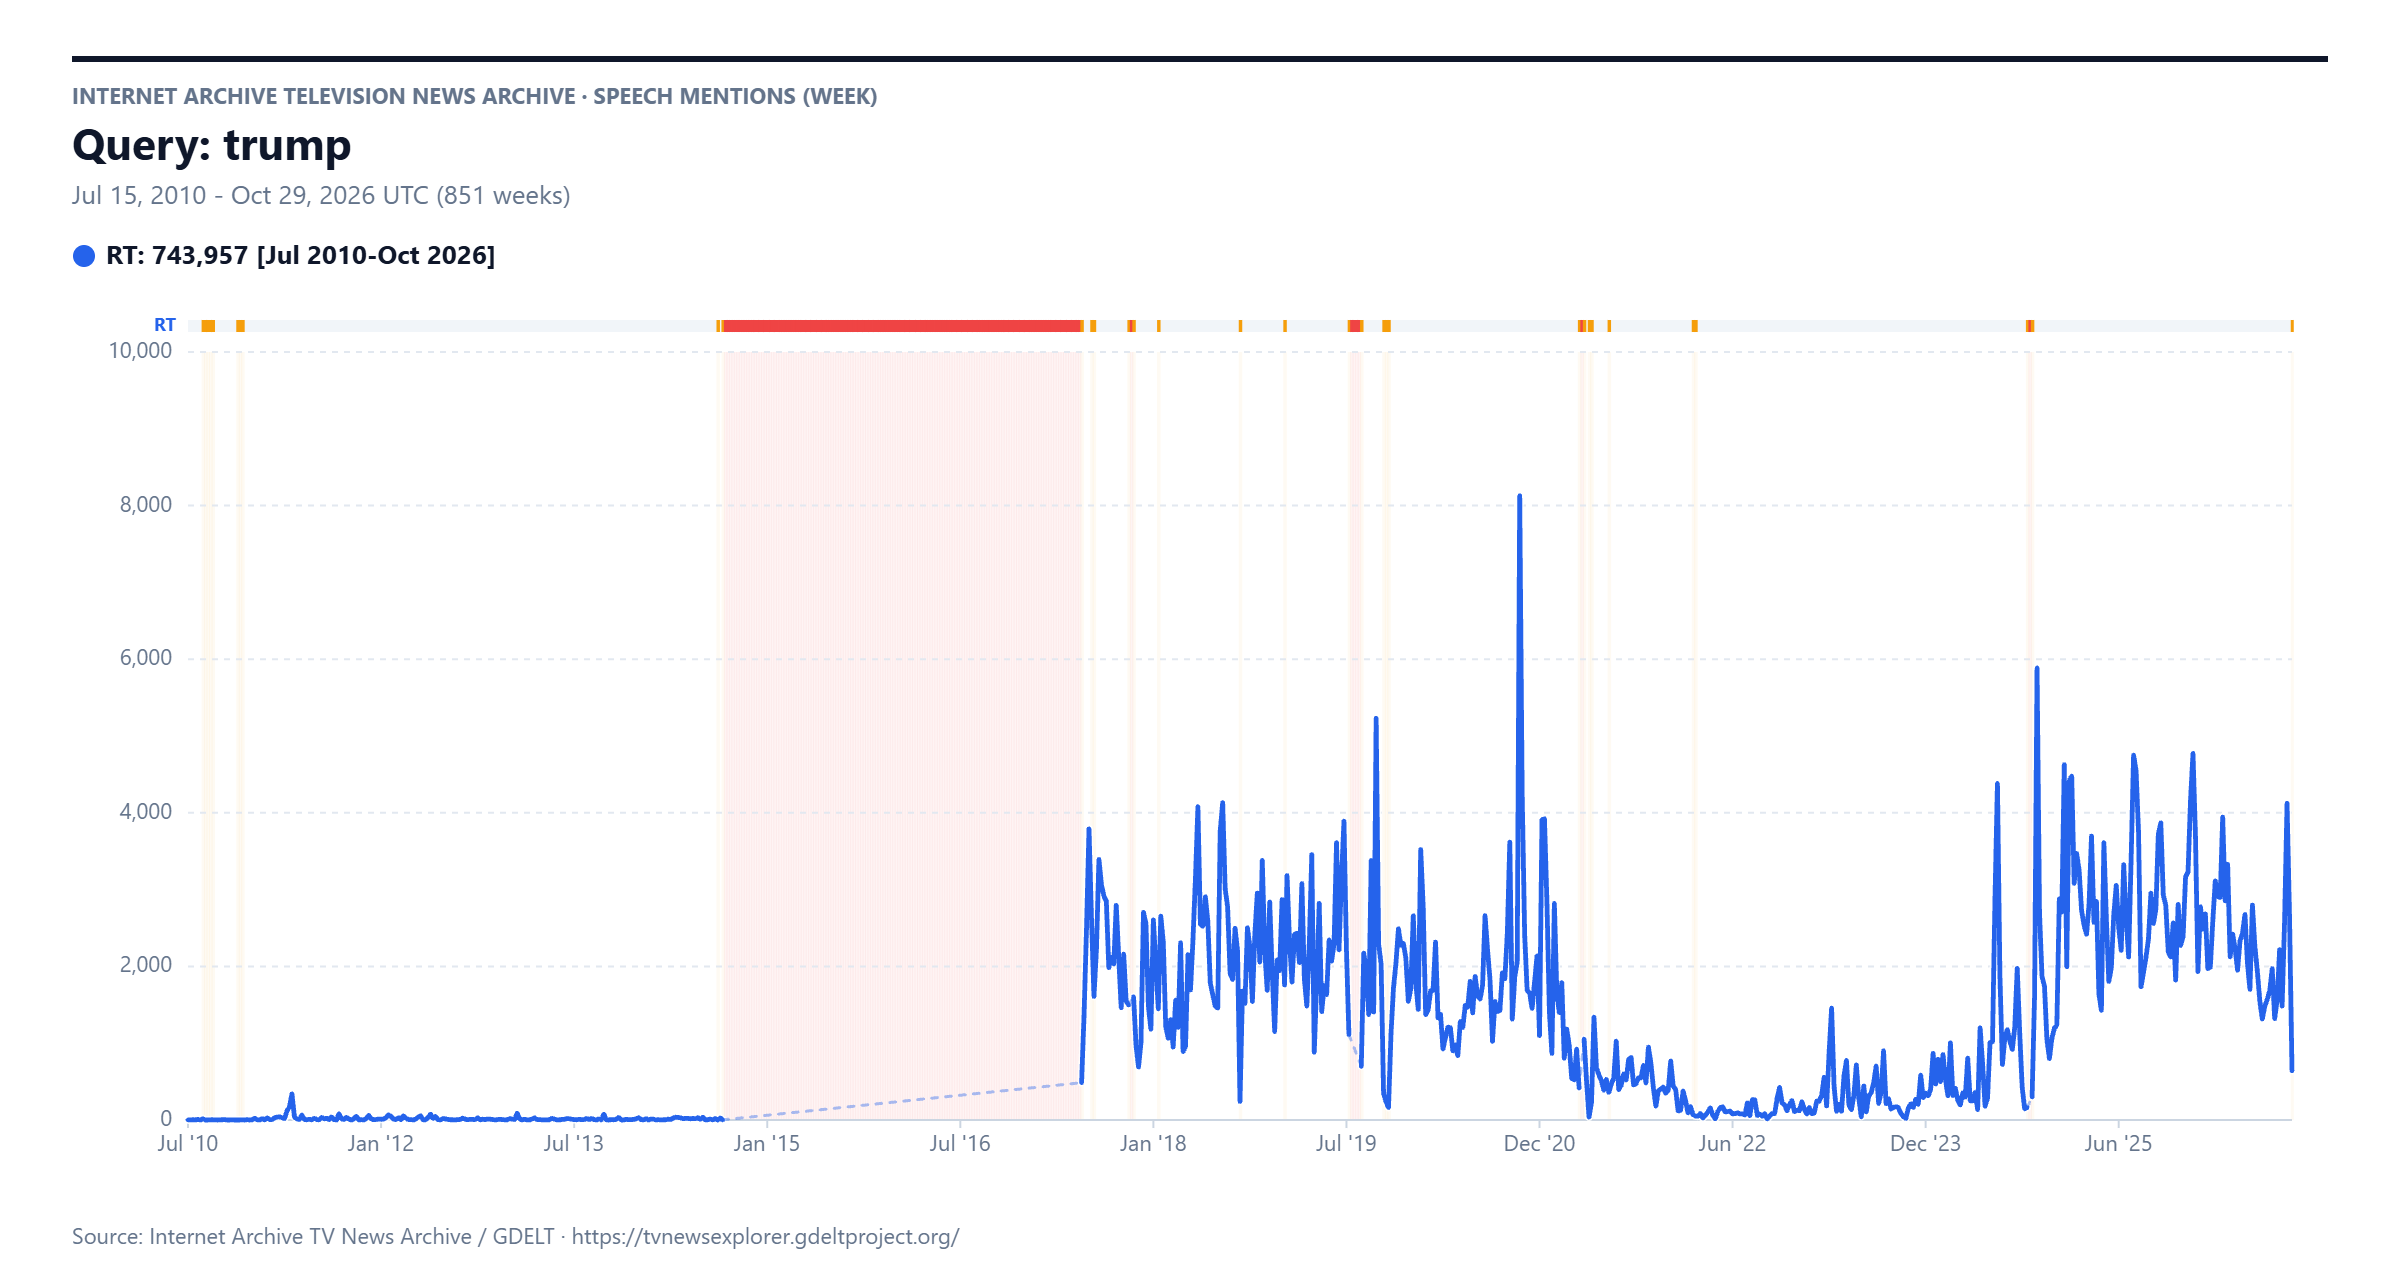
In contrast, the new system highlights the 2014-2017 total outage and the subsequent brief total and partial outages. This graph also makes it clear that the 2021-2024 significant reduction in Trump mentions is a true result, with monitoring volume normal during that period.
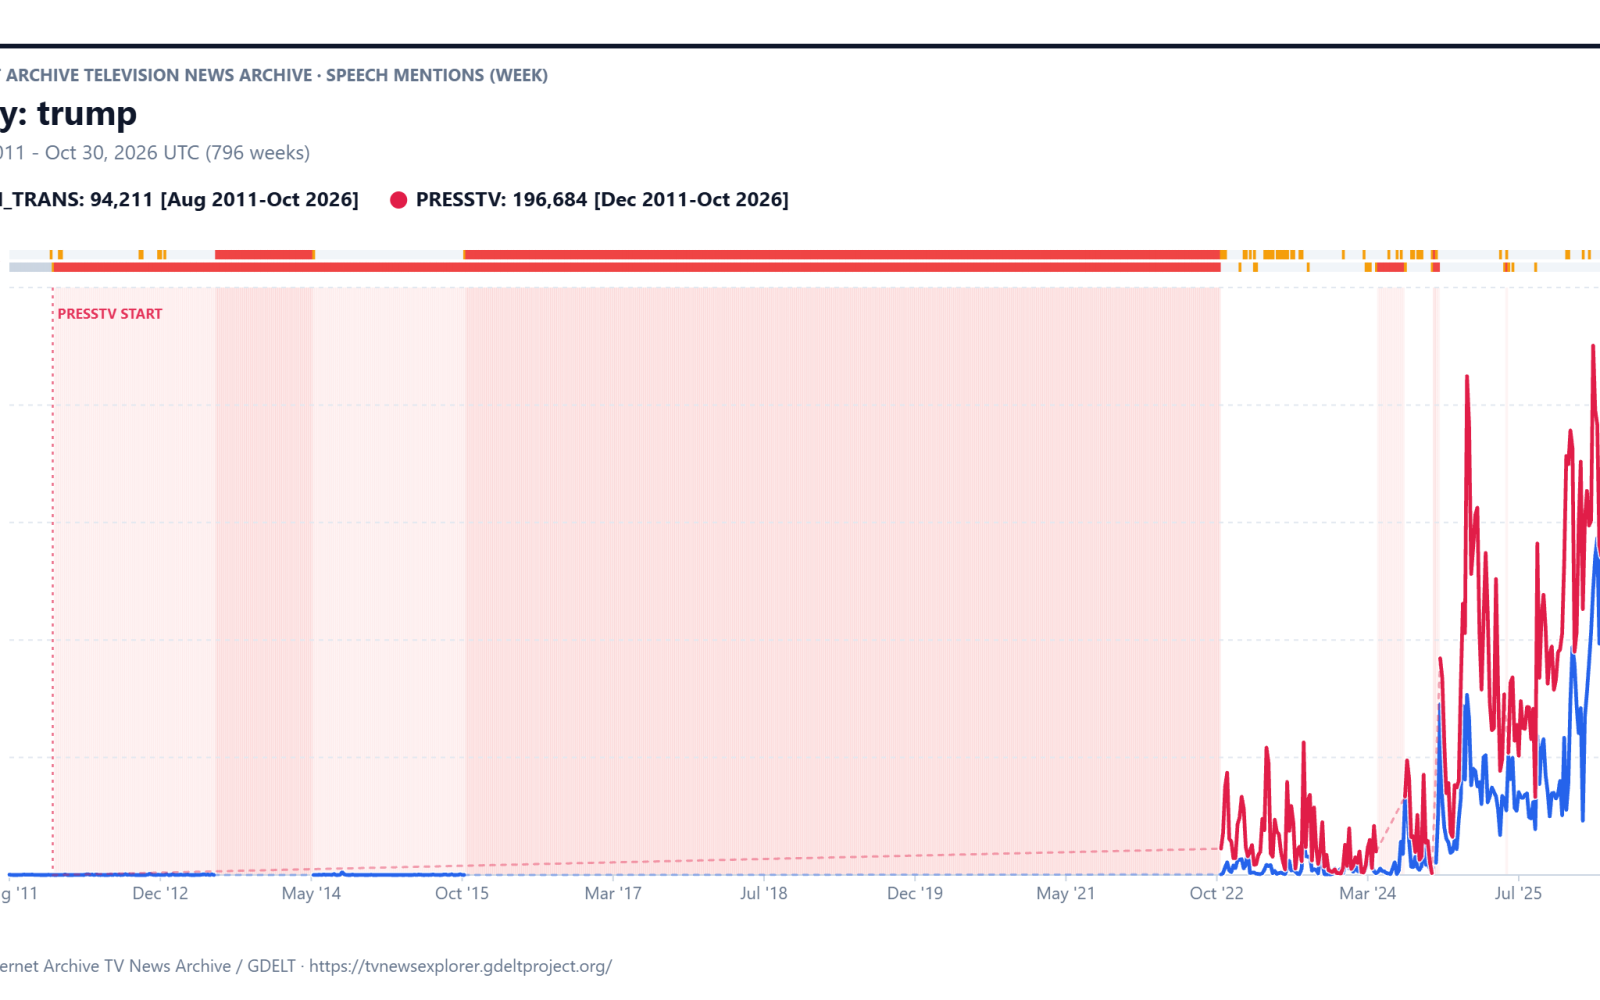
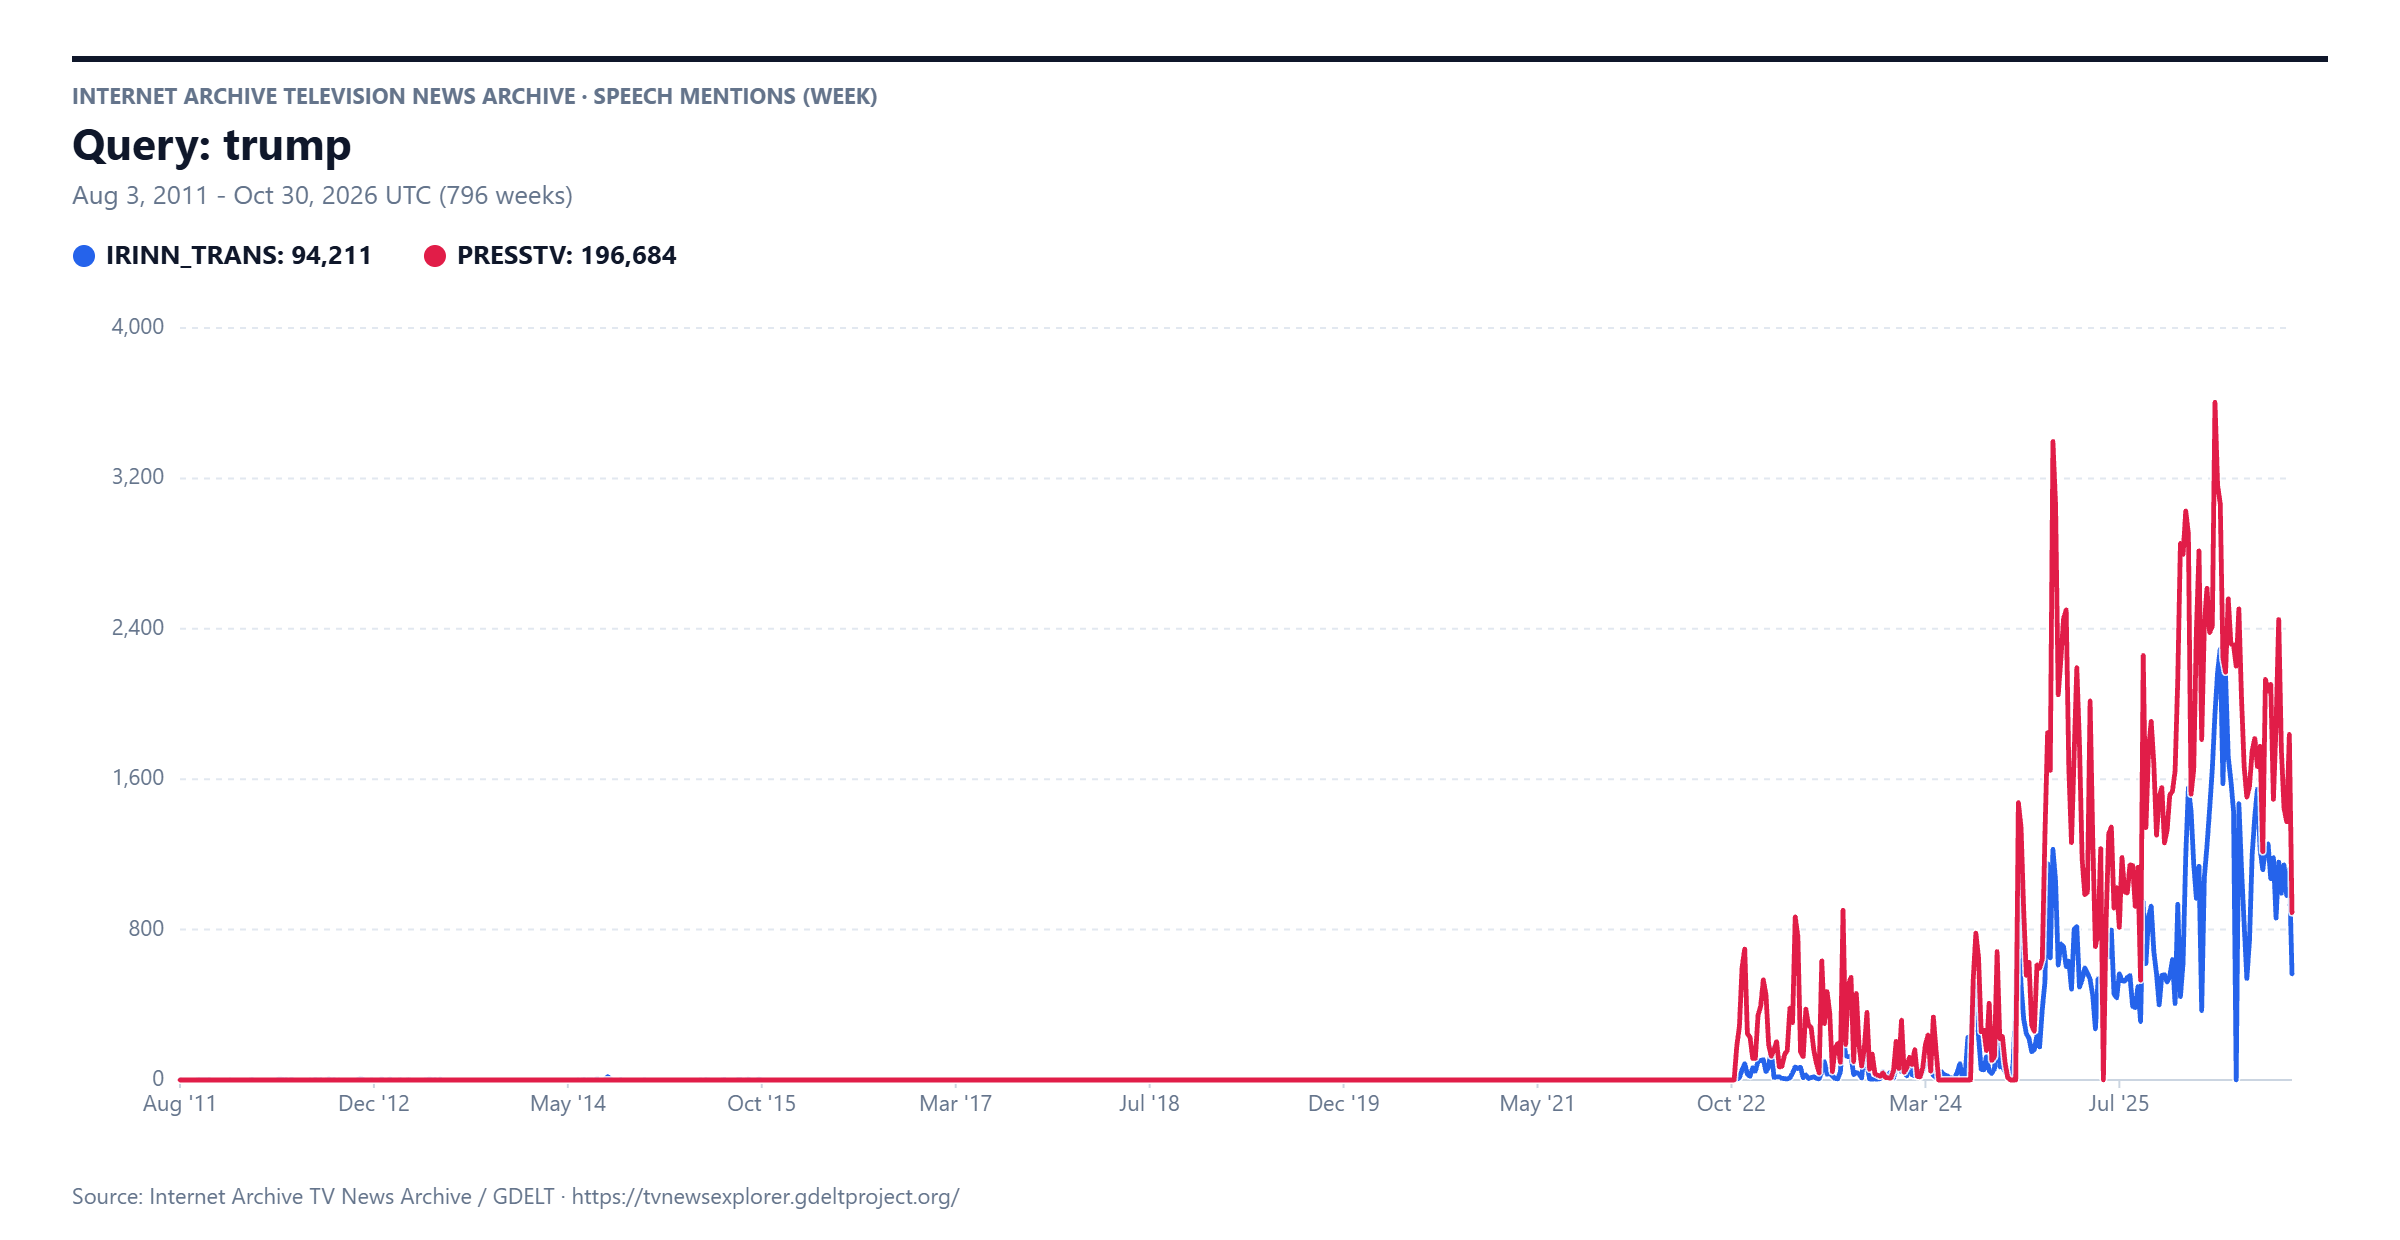
Cross-channel comparisons were historically one of the most complex to verify, since different channels, even from the same country, often begin and end at different times and have different outage patterns. Take for example, this timeline of Trump mentions on Iranian channels IRINN (English translations) and PressTV from August 2011 to present. There is a vertical surge in mentions on October 24, 2022 and few mentions prior, with only a smattering of mentions visible here and there. Does this mean that Iranian television news simply had no interest in Trump until October 2022? A glance at the Visual Explorer records for the two channels show the first monitored shows for IRINN on August 2, 2011 and PressTV on September 11, 2011, so the results below should be a legitimate reflection of Iranian news simply not focusing on Trump until late 2022, right?
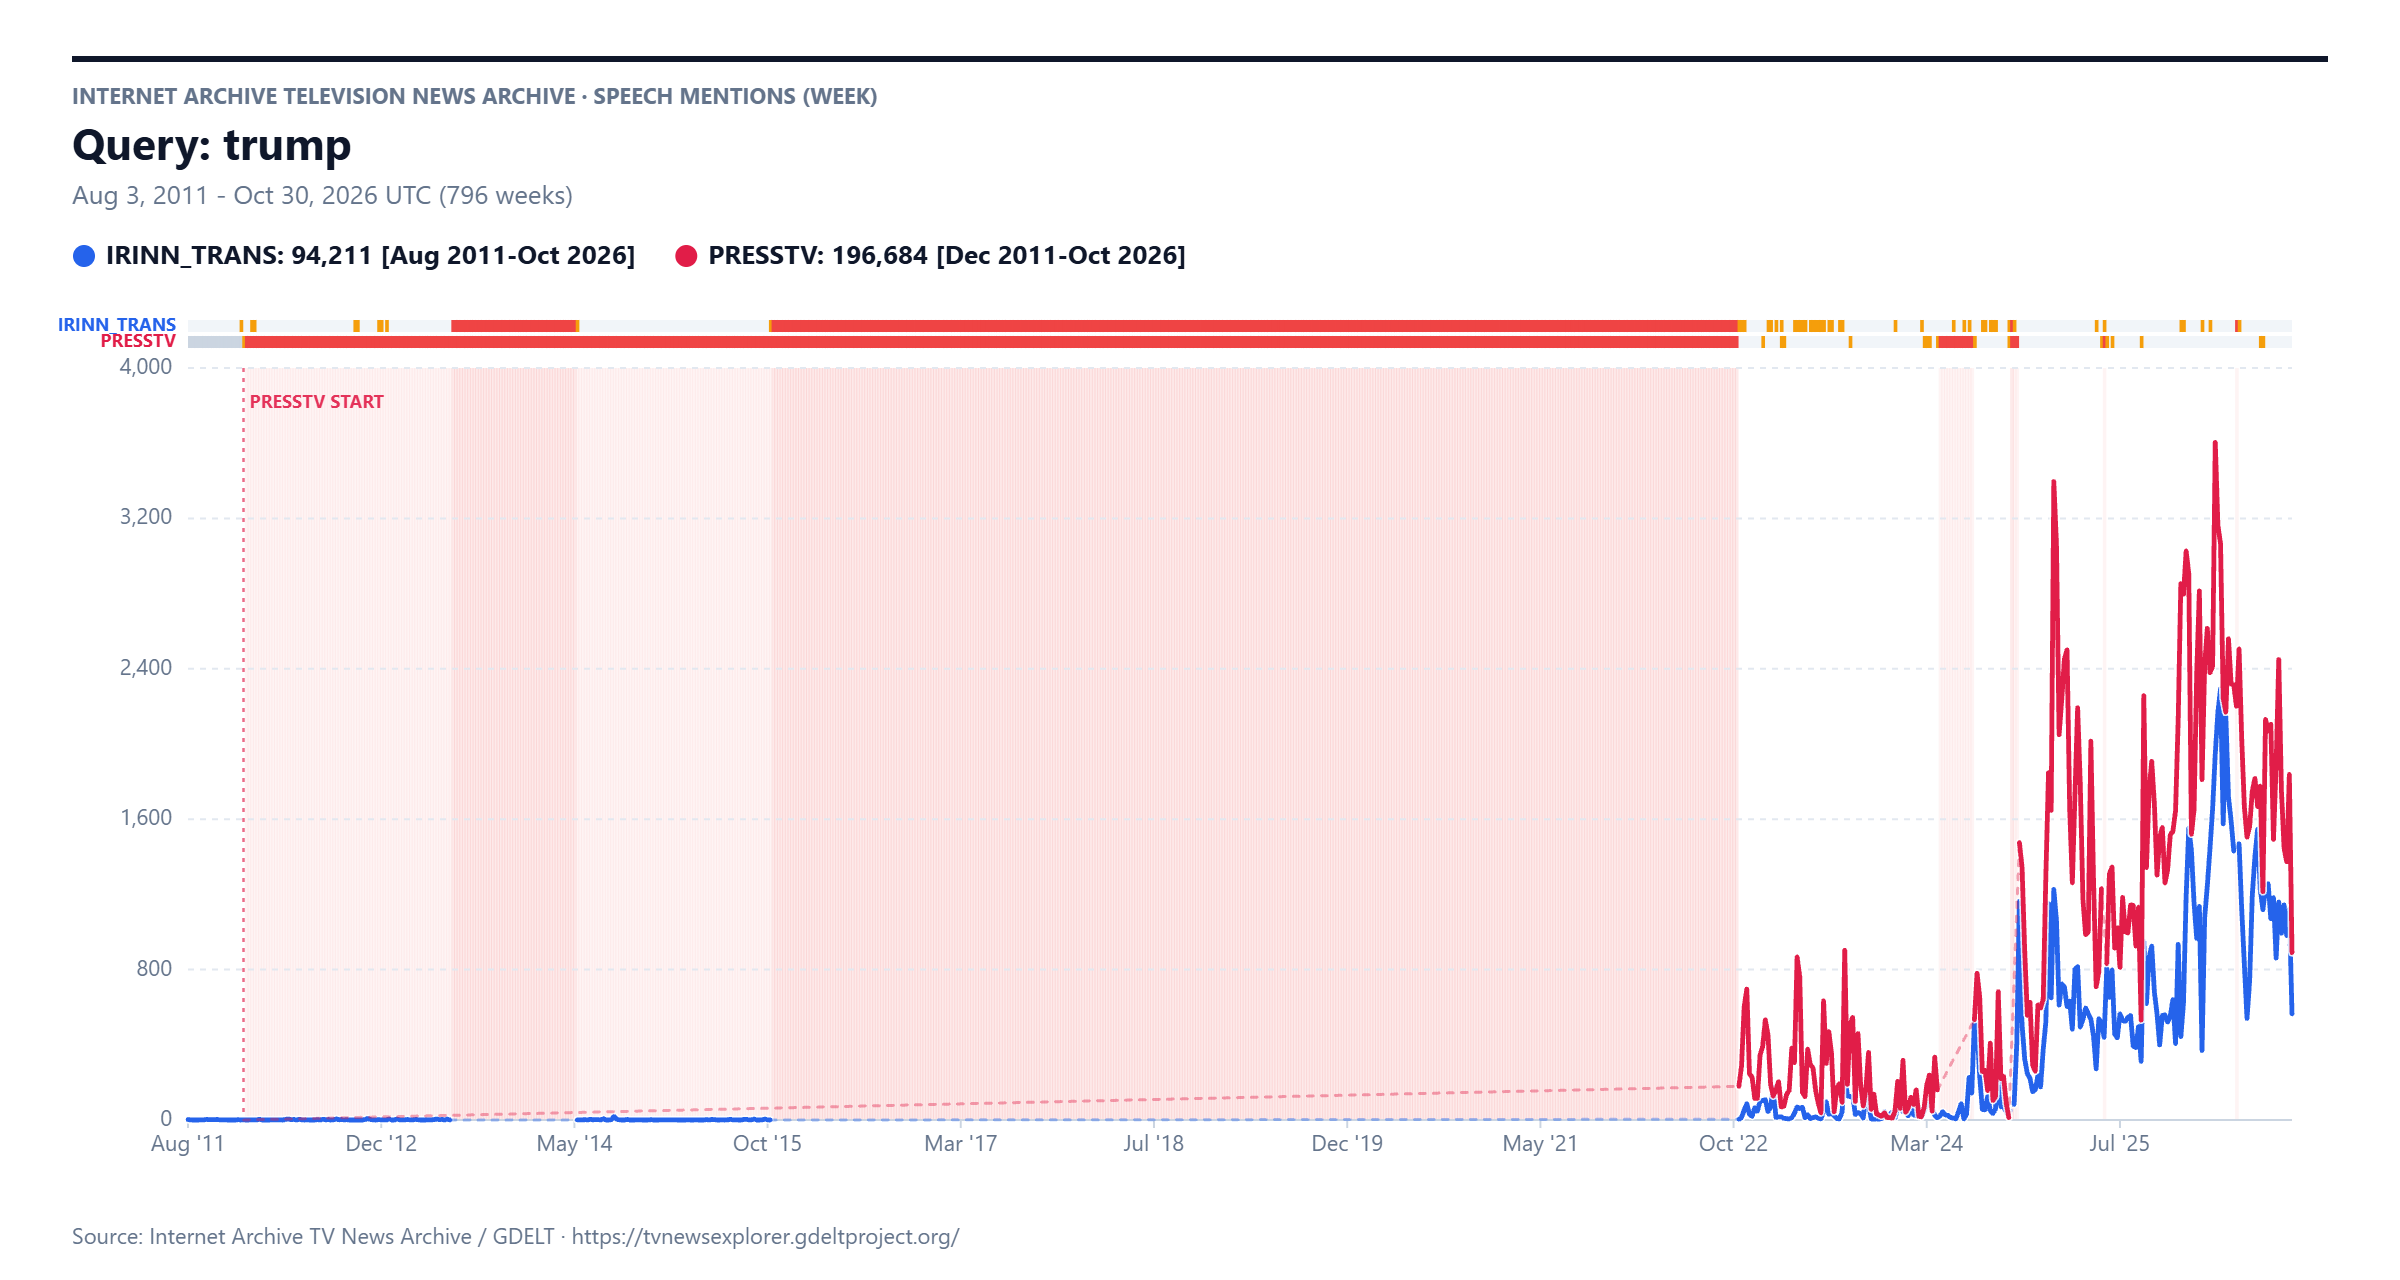
In contrast, here is the new display. Here we can see that while PressTV monitoring officially began September 11, 2011, there are no actual shows in the Archive until a single day, December 28, 2011, after which it was not monitored again until October 24, 2022. In contrast, IRINN was monitored from August 2011 until July 2013, with several outages, then again from the end of May 2014 through the end of October 2015 and only reactivated again from November 2022 through present. Whereas the timeline above made it impossible to tell whether the near-zero mentions until October 2022 were legitimate or not, the annotated timeline below makes it clear this earlier period consists largely of just a few isolated periods of coverage and that trends prior to October 2022 are not comparable across the two channels and are complex to interpret. We want to flag these anomalies, but we don't want to remove this earlier period, since those brief monitored periods might contain critically relevant results.
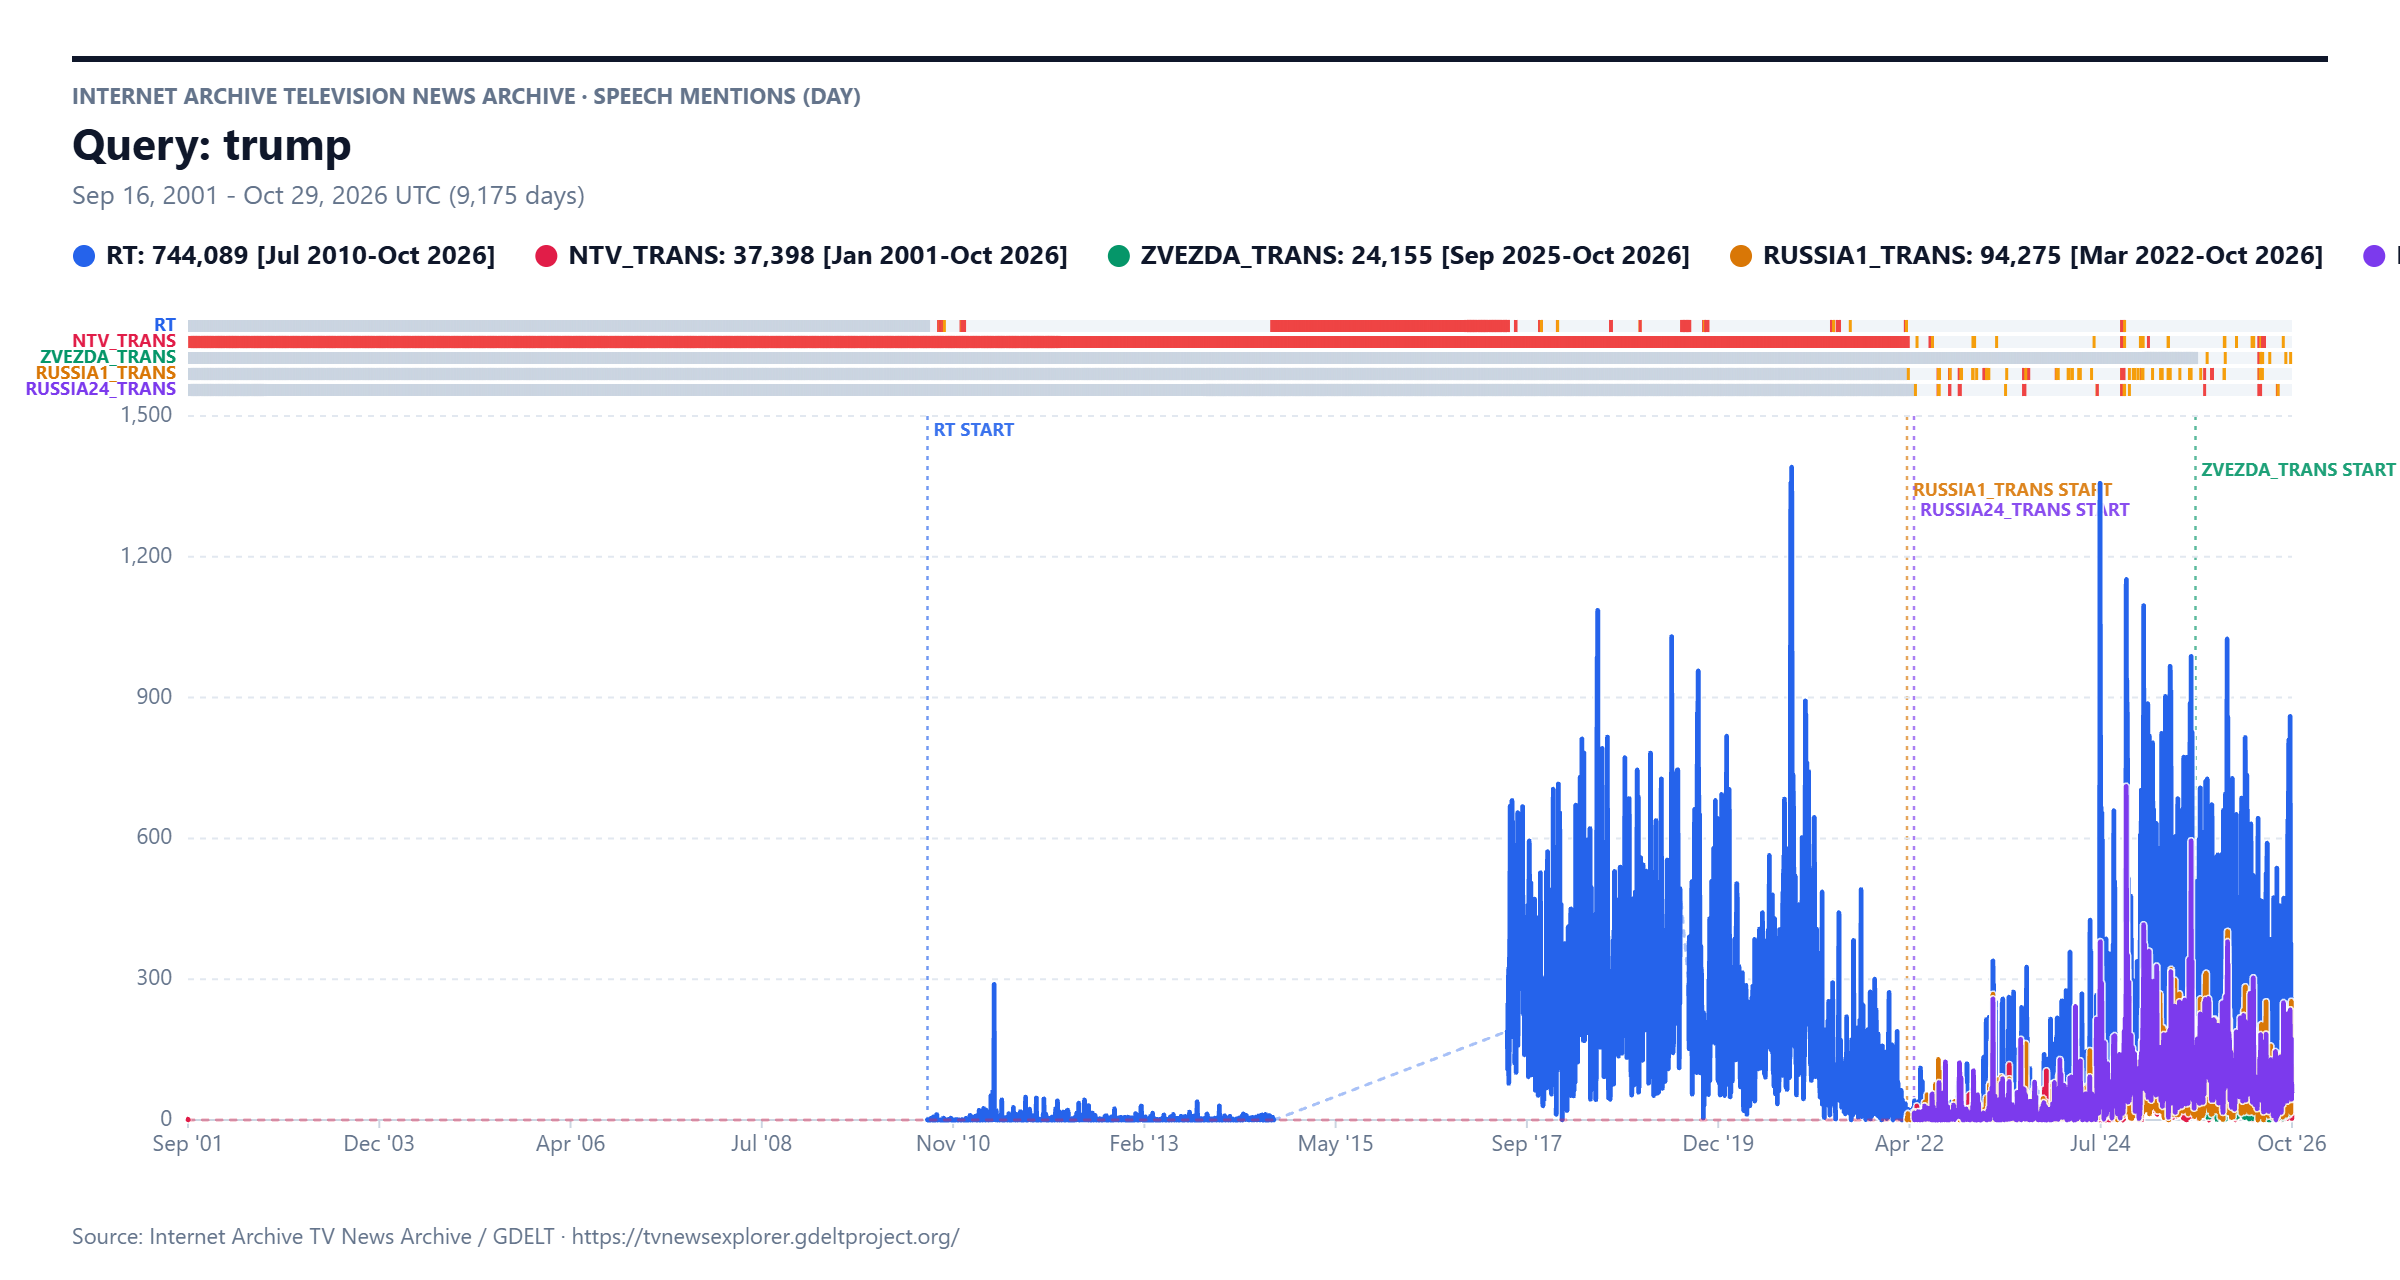
A more complex example can be seen below, tracing Trump mentions across five of the Russian television news channels in the Archive. Here we can see that NTV has a single day of coverage on September 16, 2001 and then was not monitored again until March 25, 2022. Russia Today's outage is clearly visible. Yet, even if we limit ourselves to June 2022 to present, we can see that Zvezda unexpectedly does not begin until September 3, 2025, meaning cross-channel analyses that wish to consider all of the Russian channels together must limit themselves to only the past year. There are also multiple brief partial and total outages across all five of the channels since monitoring began, necessitating careful consideration and normalization of their results.
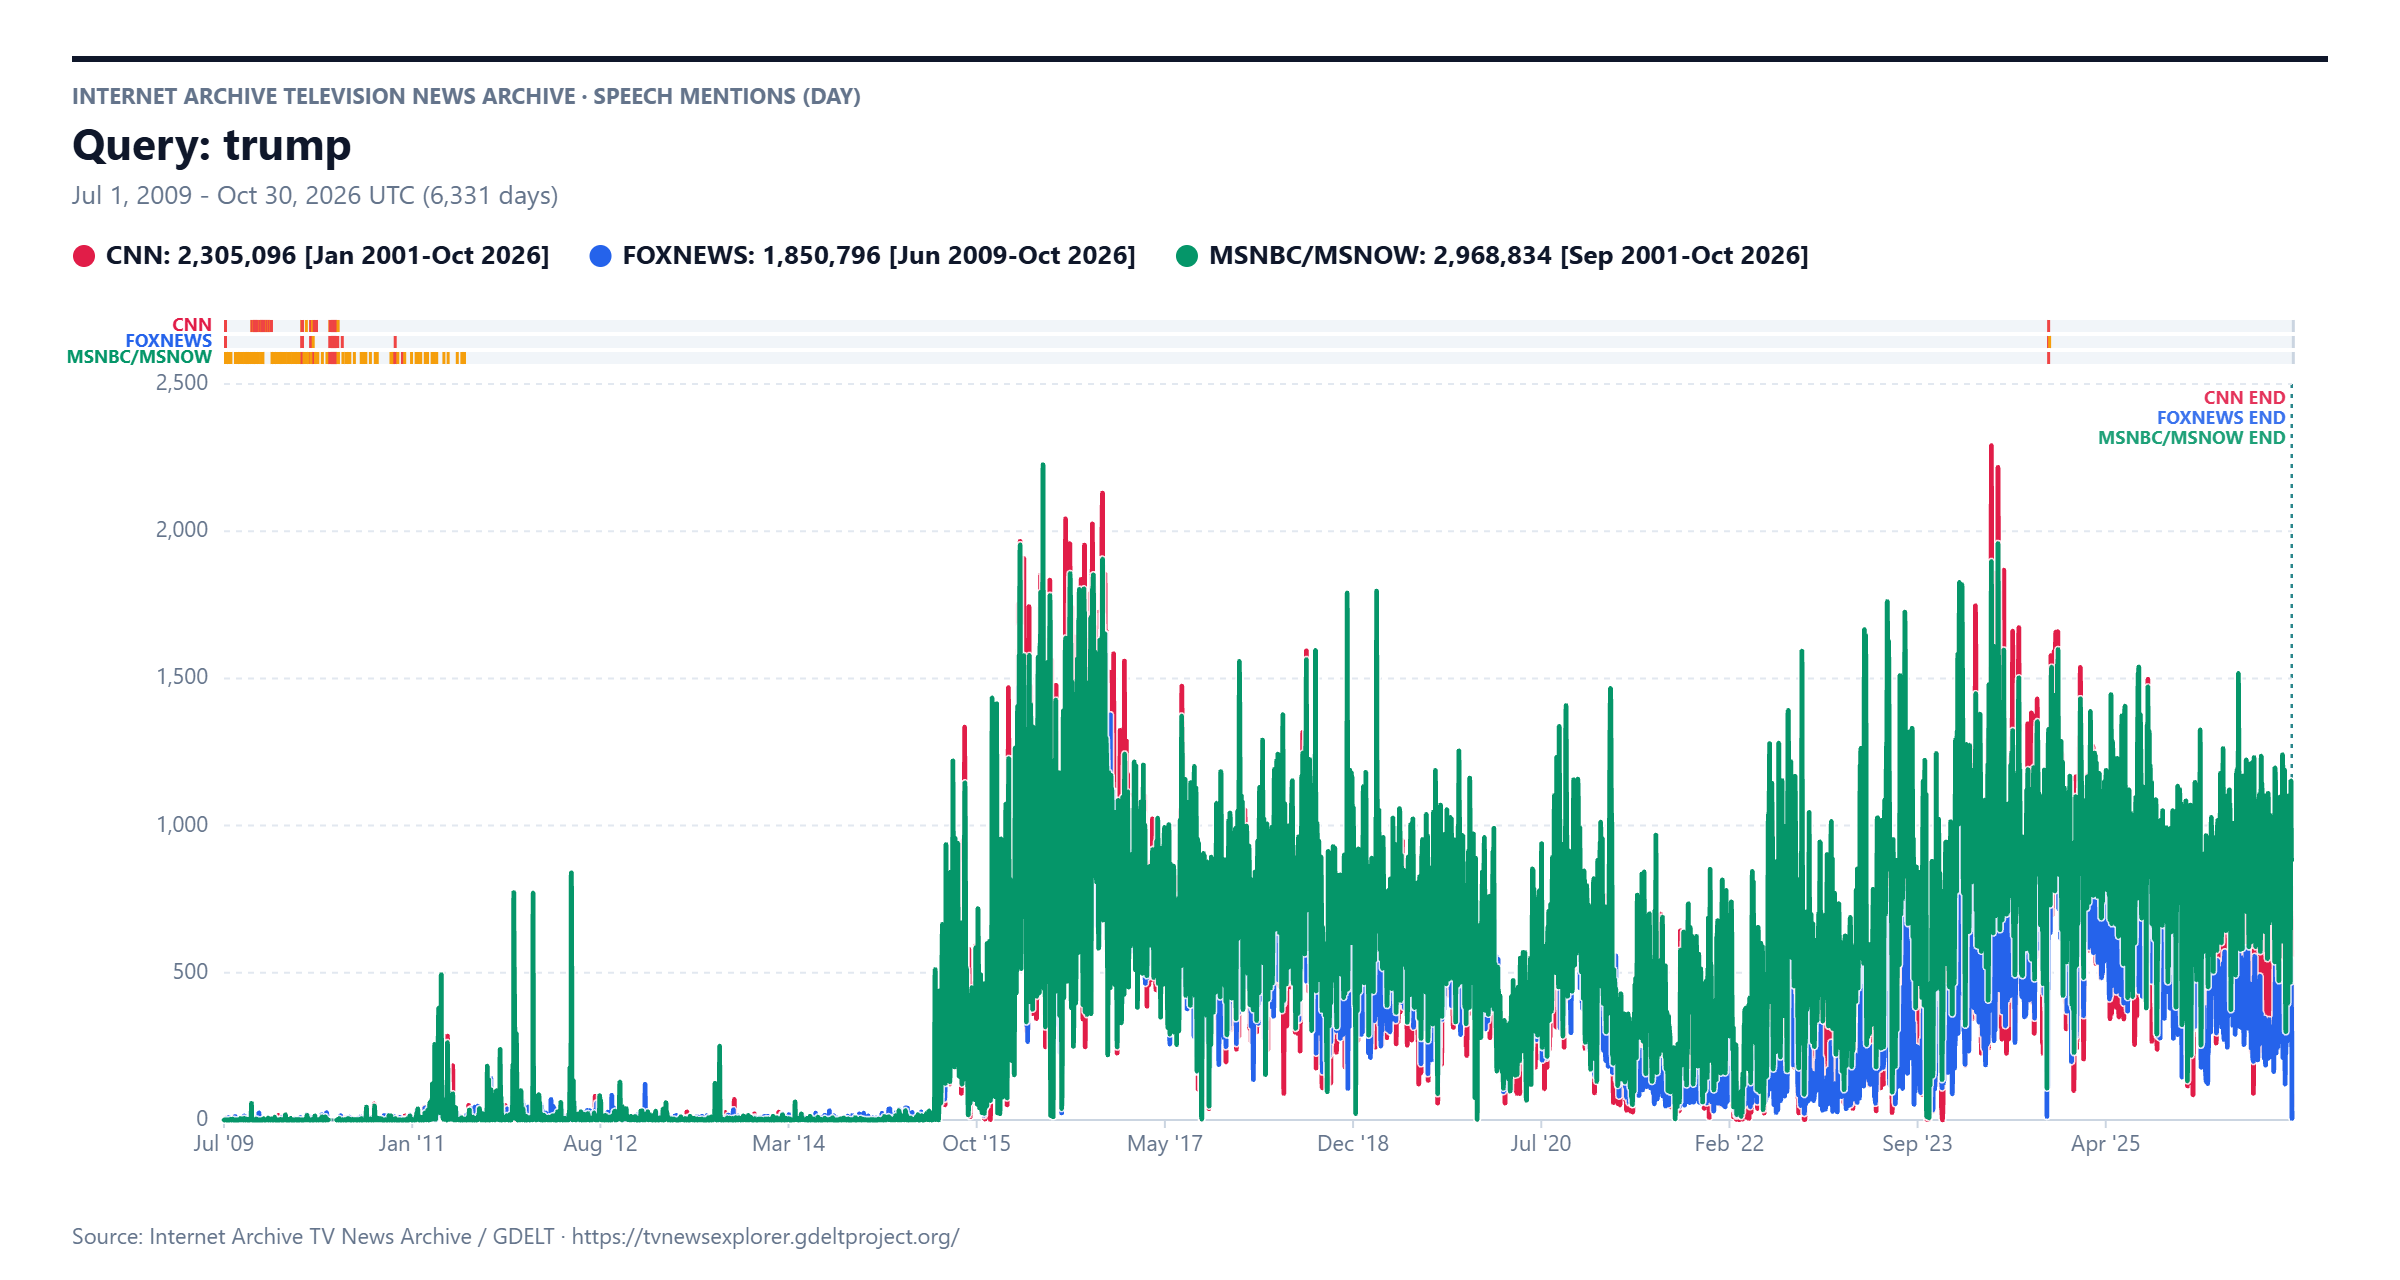
Finally, let's take a look at CNN, MSNBC/MSNOW and Fox News coverage of Trump. Here we can see that the vertical surge in June 2015 is real, with no outages at that time period. We can see that all of the outages partial losses are limited to the 2009 and 2011 and are fairly minimal, with the only recent outage being a few days in October 2024 during a technical failure. This tells us that for these three channels we can safely perform cross-comparative longitudinal analyses of their coverage without further concern about normalization.