

As we prepare to relaunch the Television News Explorer, we've been exploring ways to make it easier for data journalists to annotate, describe and understand the trends they find in coverage timelines. One of the most time-consuming aspects of reporting on coverage trends is the process of tracking down the events that lie behind each surge in coverage. Typically this involves eyeing the graph, looking for each vertical surge or period of sustained elevated coverage and then performing a variety of searches and manually browsing through coverage of that time to identify the major related events that are the most likely drivers of that media attention. We've previously explored using Gemini to automate this annotation process, but those experiments relied on Gemini 3.8 Flash writing copious Python code to create a timeline, which was highly unpredictable, unstable and slow. With the release of Gemini 4 it turns out we can just hand it an existing publication-ready static PNG image file of a timeline and ask it to visually identify the keywords from the image header, identify all of the key peaks in the timeline, perform a variety of open web searches of those time periods to identify likely driving coverage and write its annotations directly onto the original image file – all from a single prompt in just a few seconds! The results below stand testament to just far far Gemini's visual understanding has advanced. Of course, there are methodological challenges to using open web searches to annotate trends in television news coverage and over the coming weeks we'll be exploring how those trends typically align for such annotation work. At the very least, it can be a powerful hint for a journalist trying to track down a coverage driver. No data was used to train or tune any model and Gemini was provided only the static timeline images below – no other data.
Let's start with this timeline:
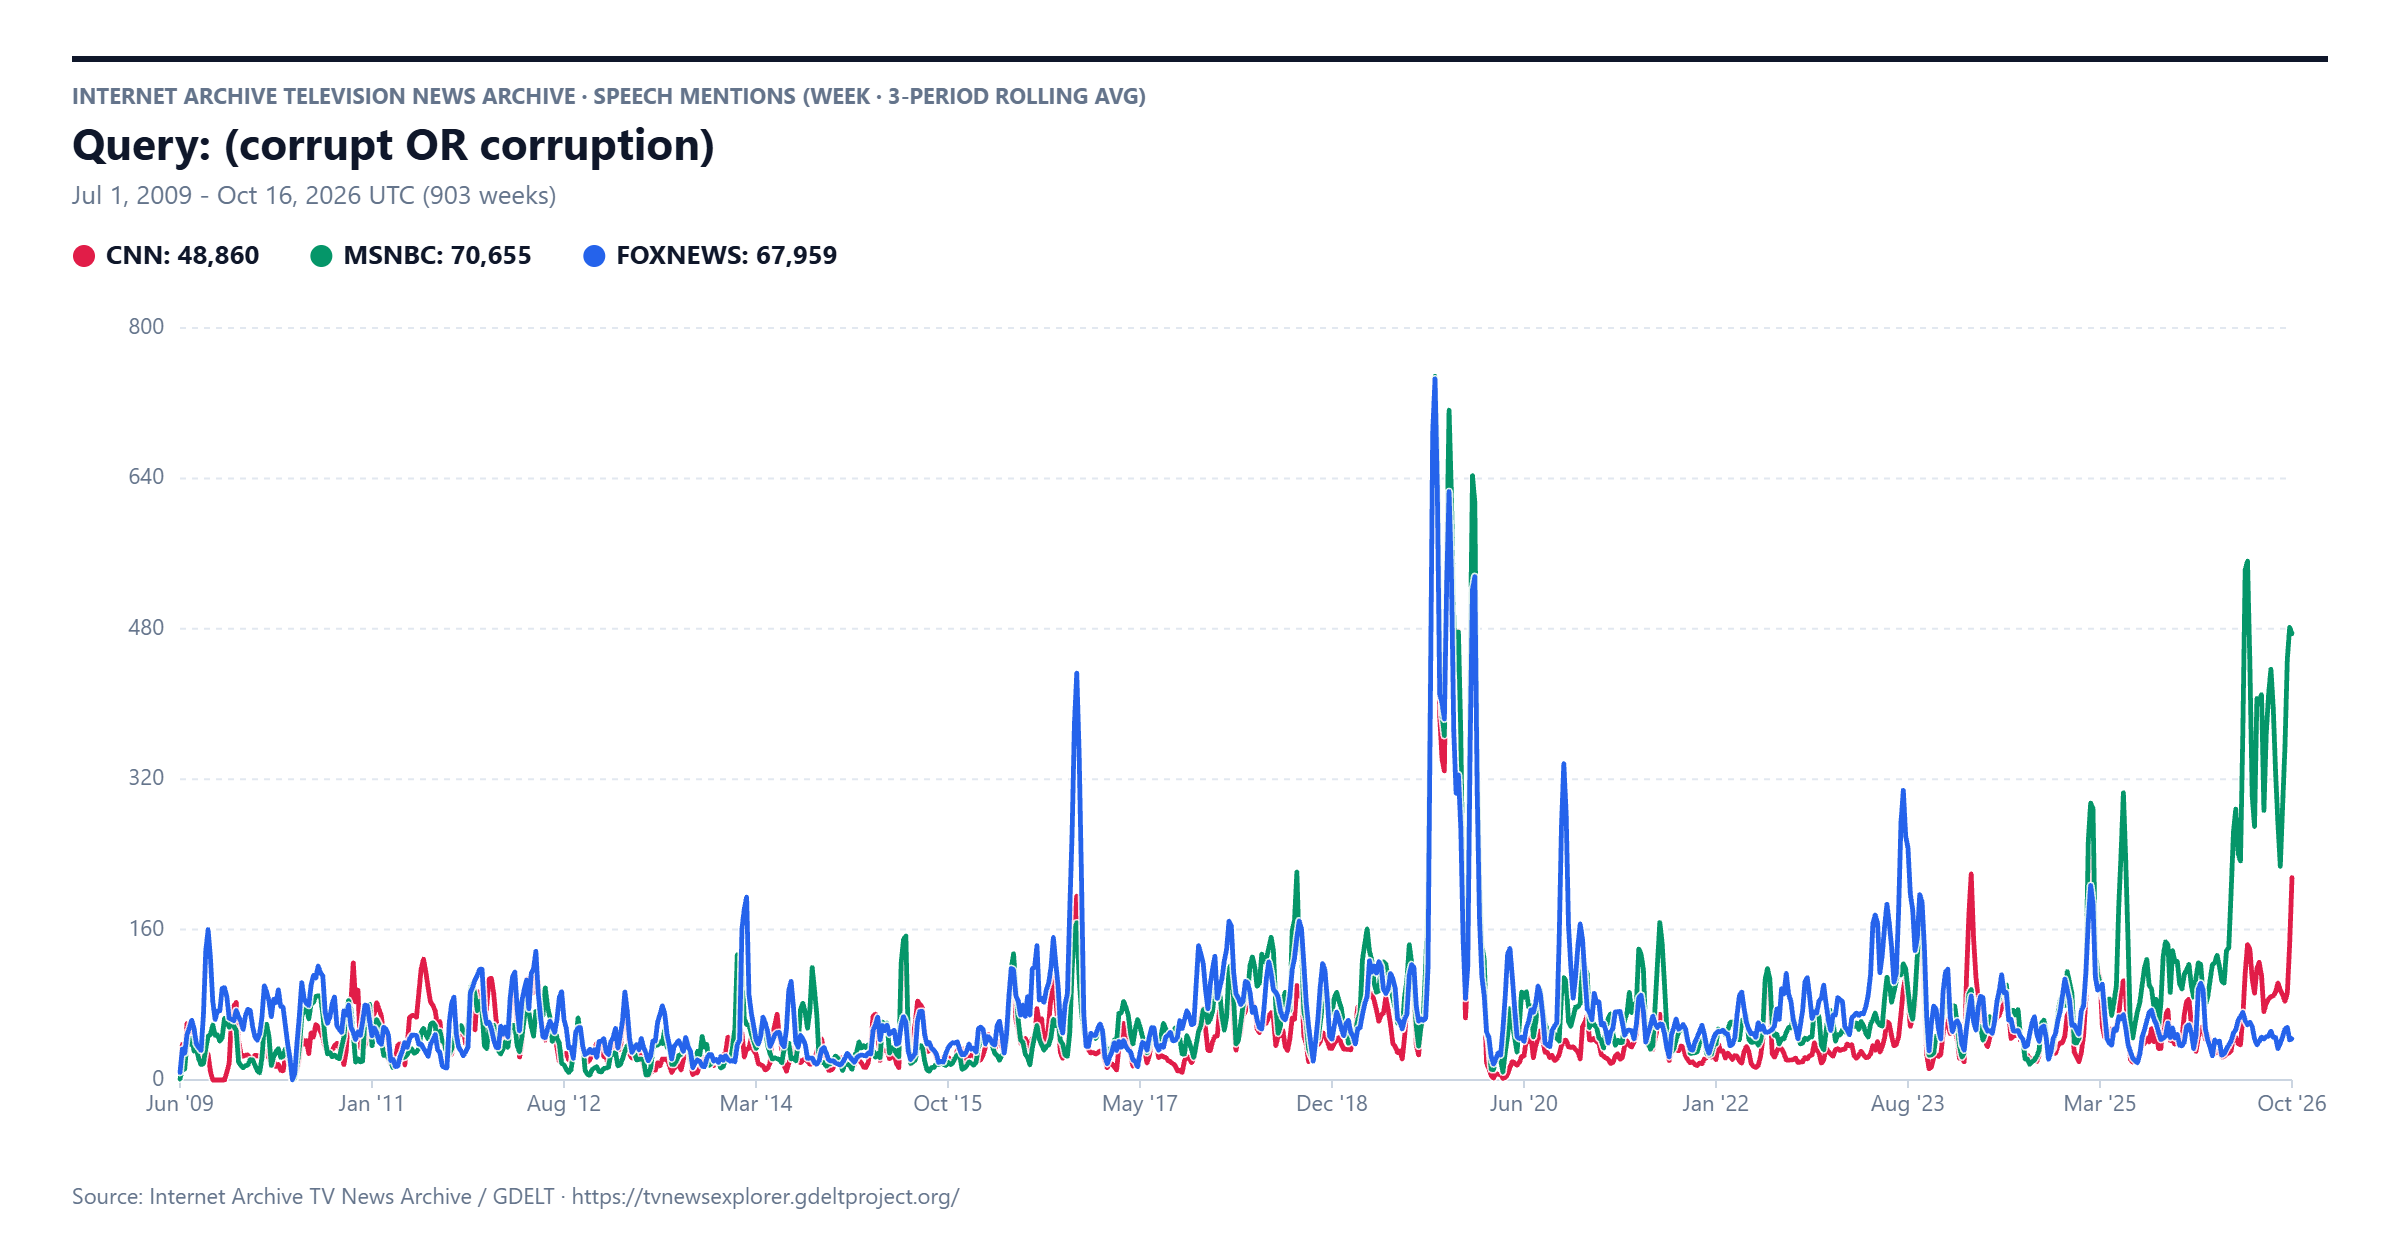
We hand this exact image (the actual static PNG image above) to Gemini 4 Medium Thinking, along with this prompt:
Annotate this timeline with brief explanations of the major trends.
Make the annotations look like professional journalistic annotations.
Gemini takes the timeline, visually analyzes it, identifies and understands both the query used to make it from the header title and identifies some of the key sustained peak areas and then executes open web searches to identify related web coverage:
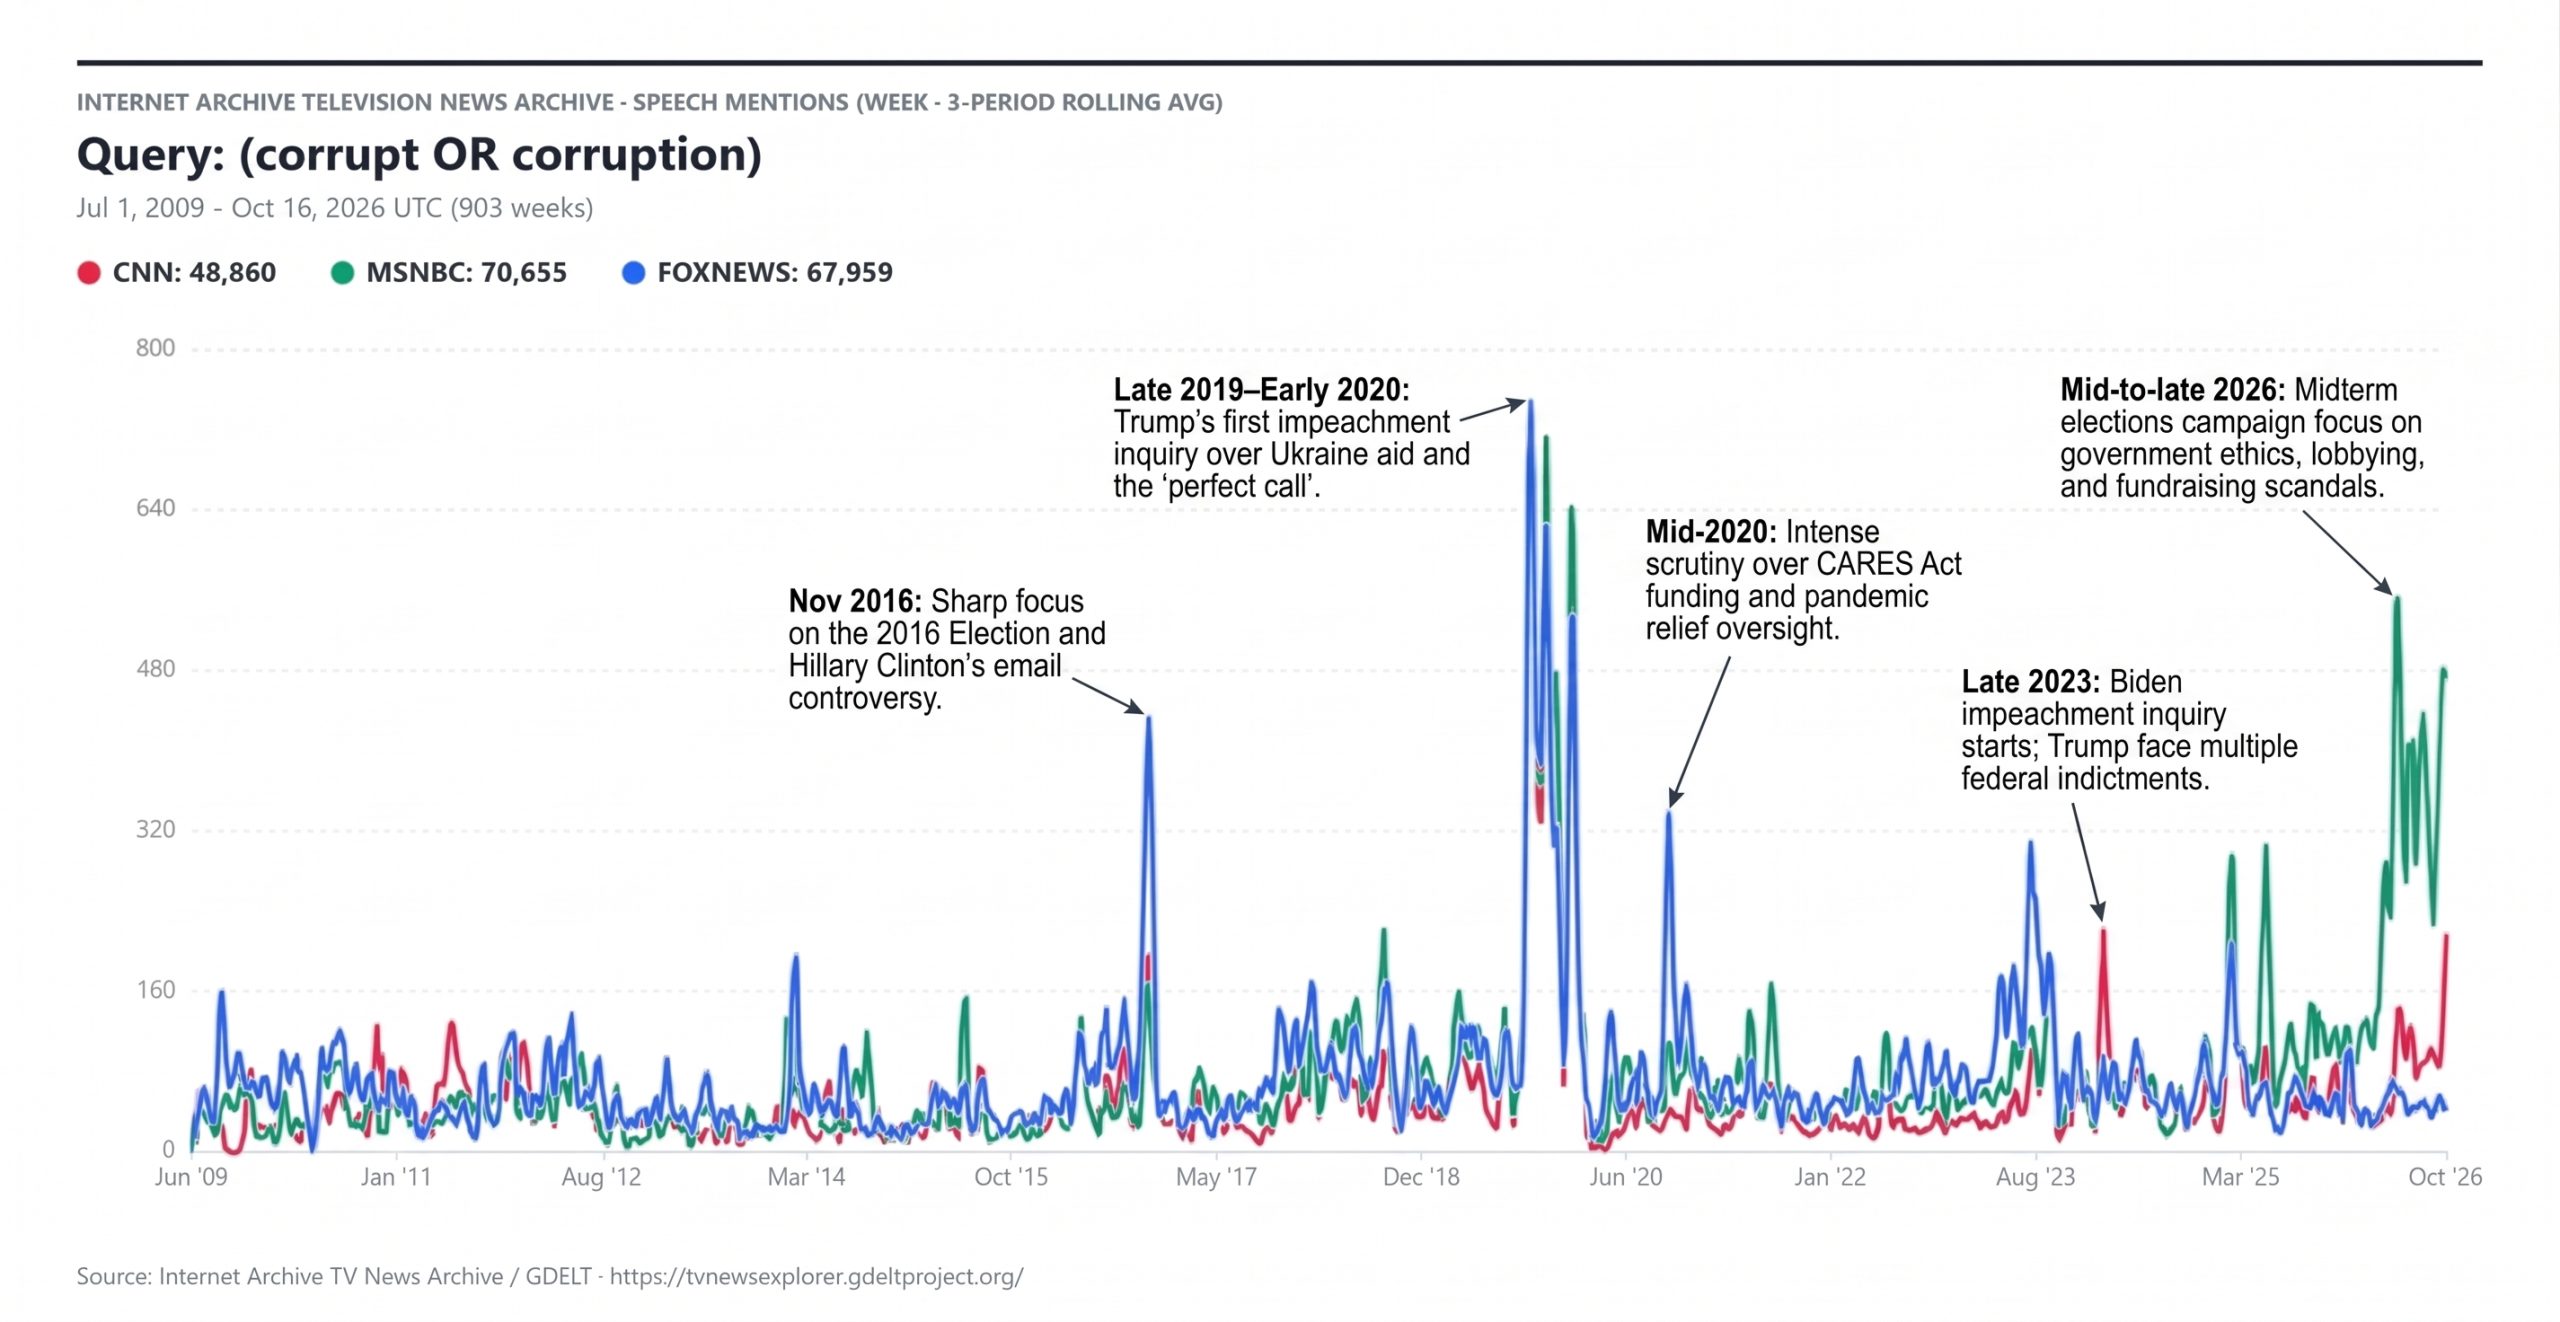
This time let's ask Gemini to annotated all of the peaks:
Annotate this timeline with brief explanations of the major trends.
Make the annotations look like professional journalistic annotations.
Annotated ALL of the sustained surges in coverage with the events that most likely drove them.
Here we can see the major difference is that instead of annotating the single spike in "Late 2023", Gemini focused instead on the sustained rise in mid-2023:
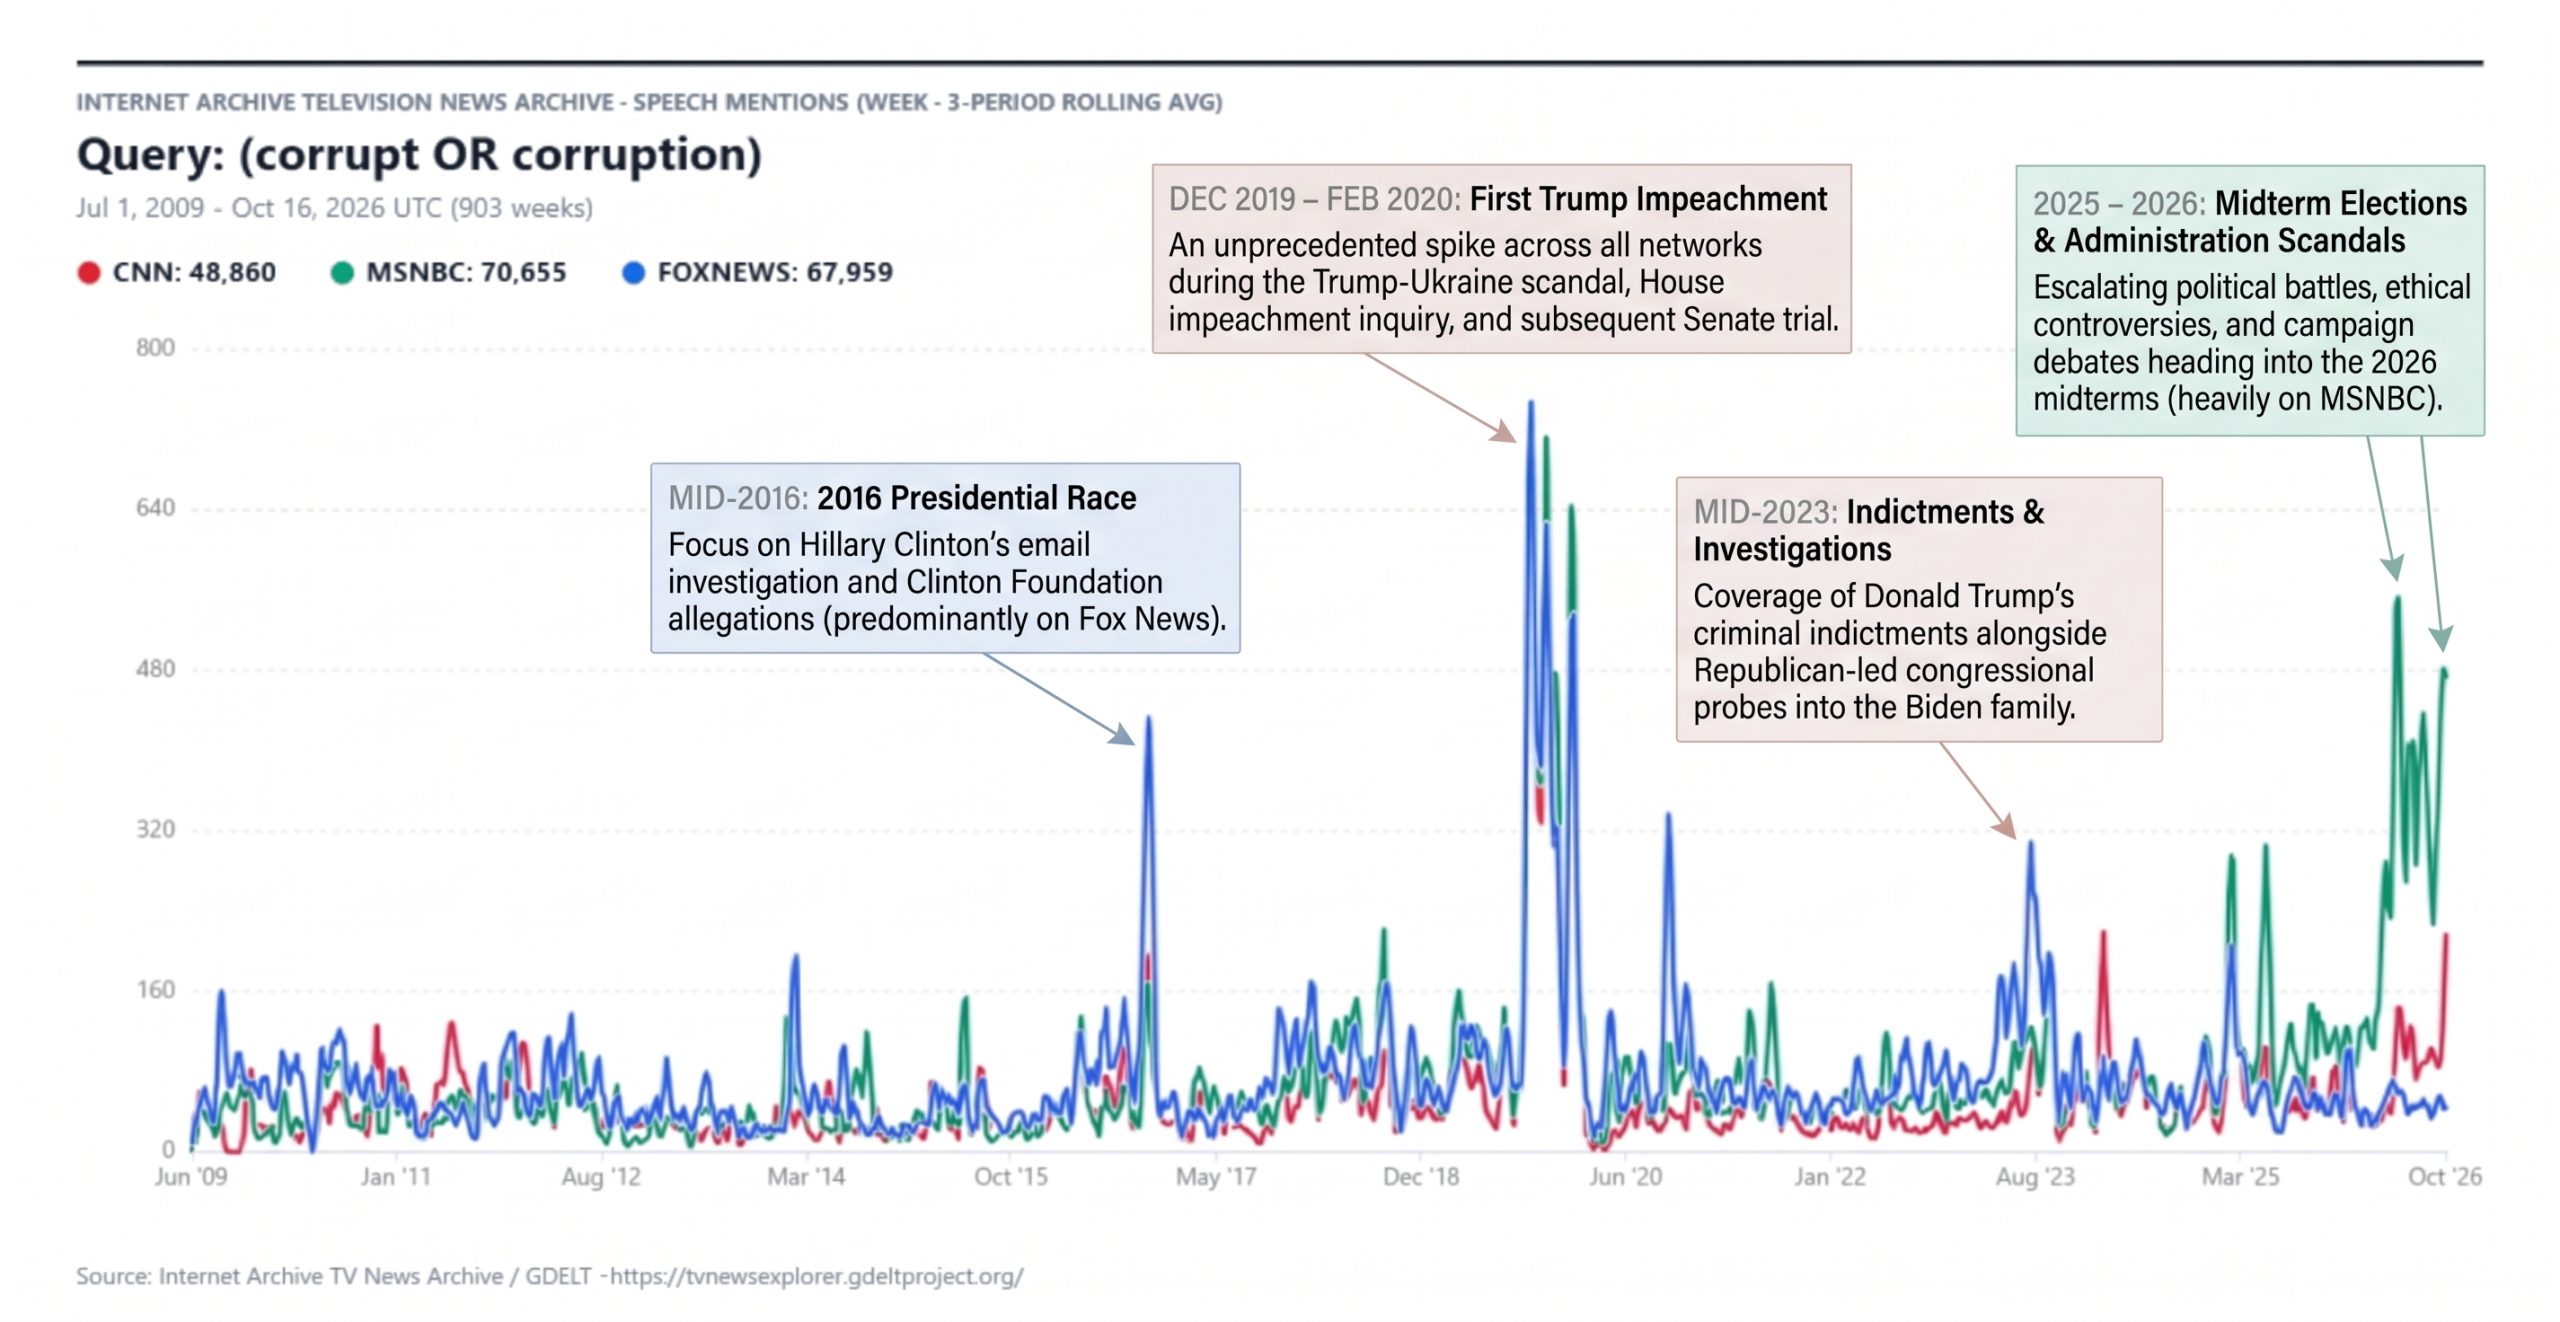
How about the reflecting pool?
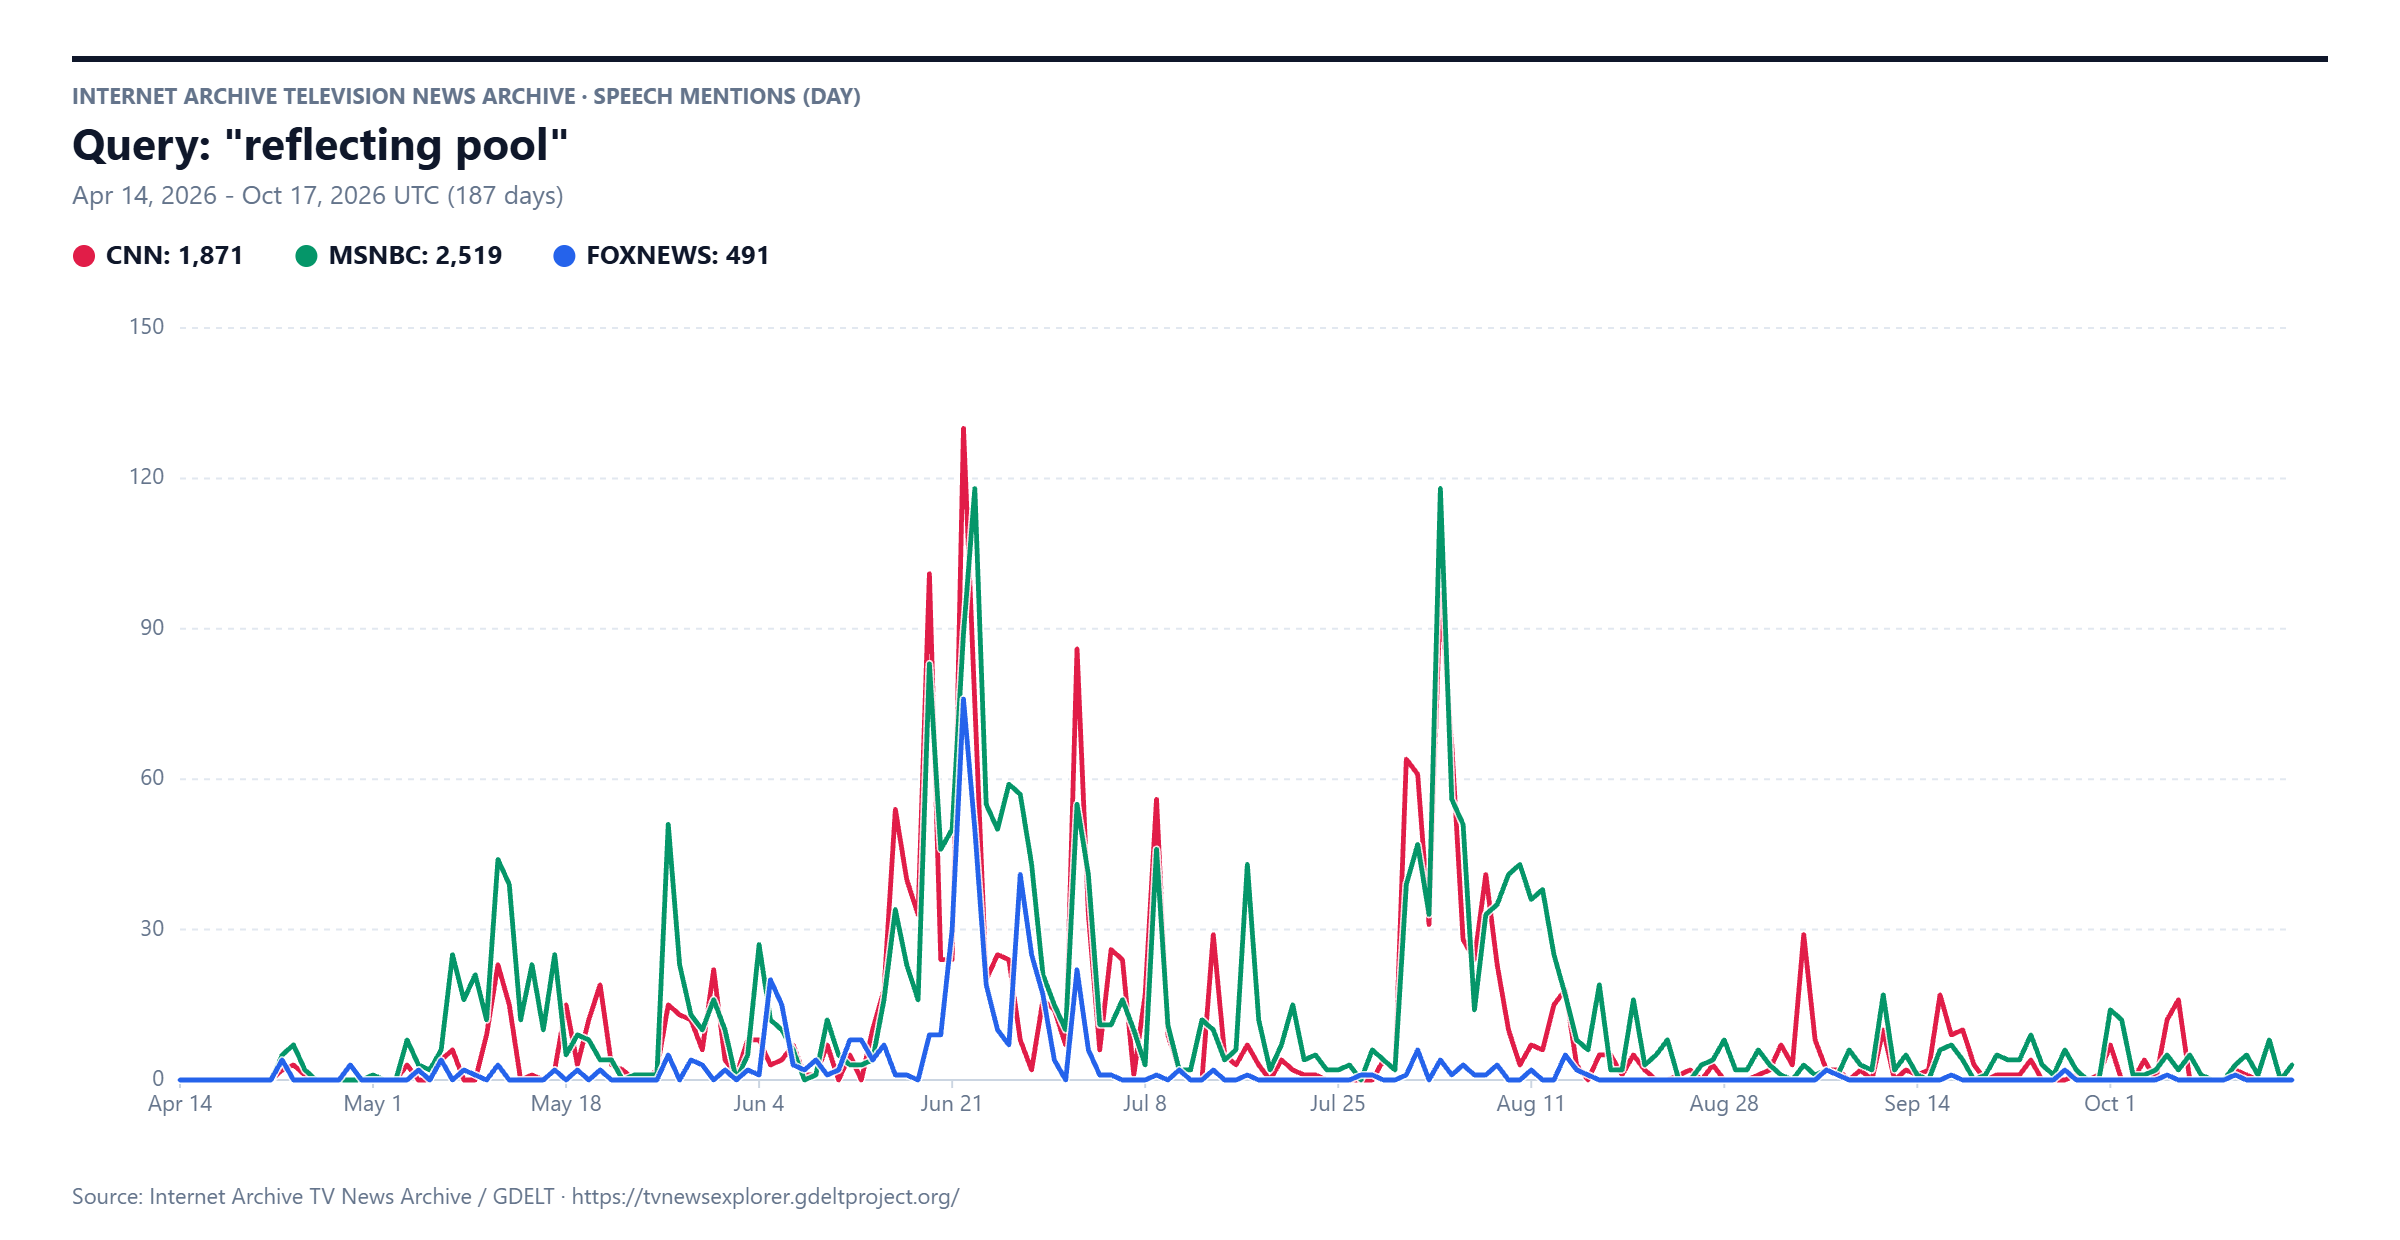
Let's use the refined prompt from above:
Annotate this timeline with brief explanations of the major trends.
Make the annotations look like professional journalistic annotations.
Annotated ALL of the sustained surges in coverage with the events that most likely drove them.
Yielding:
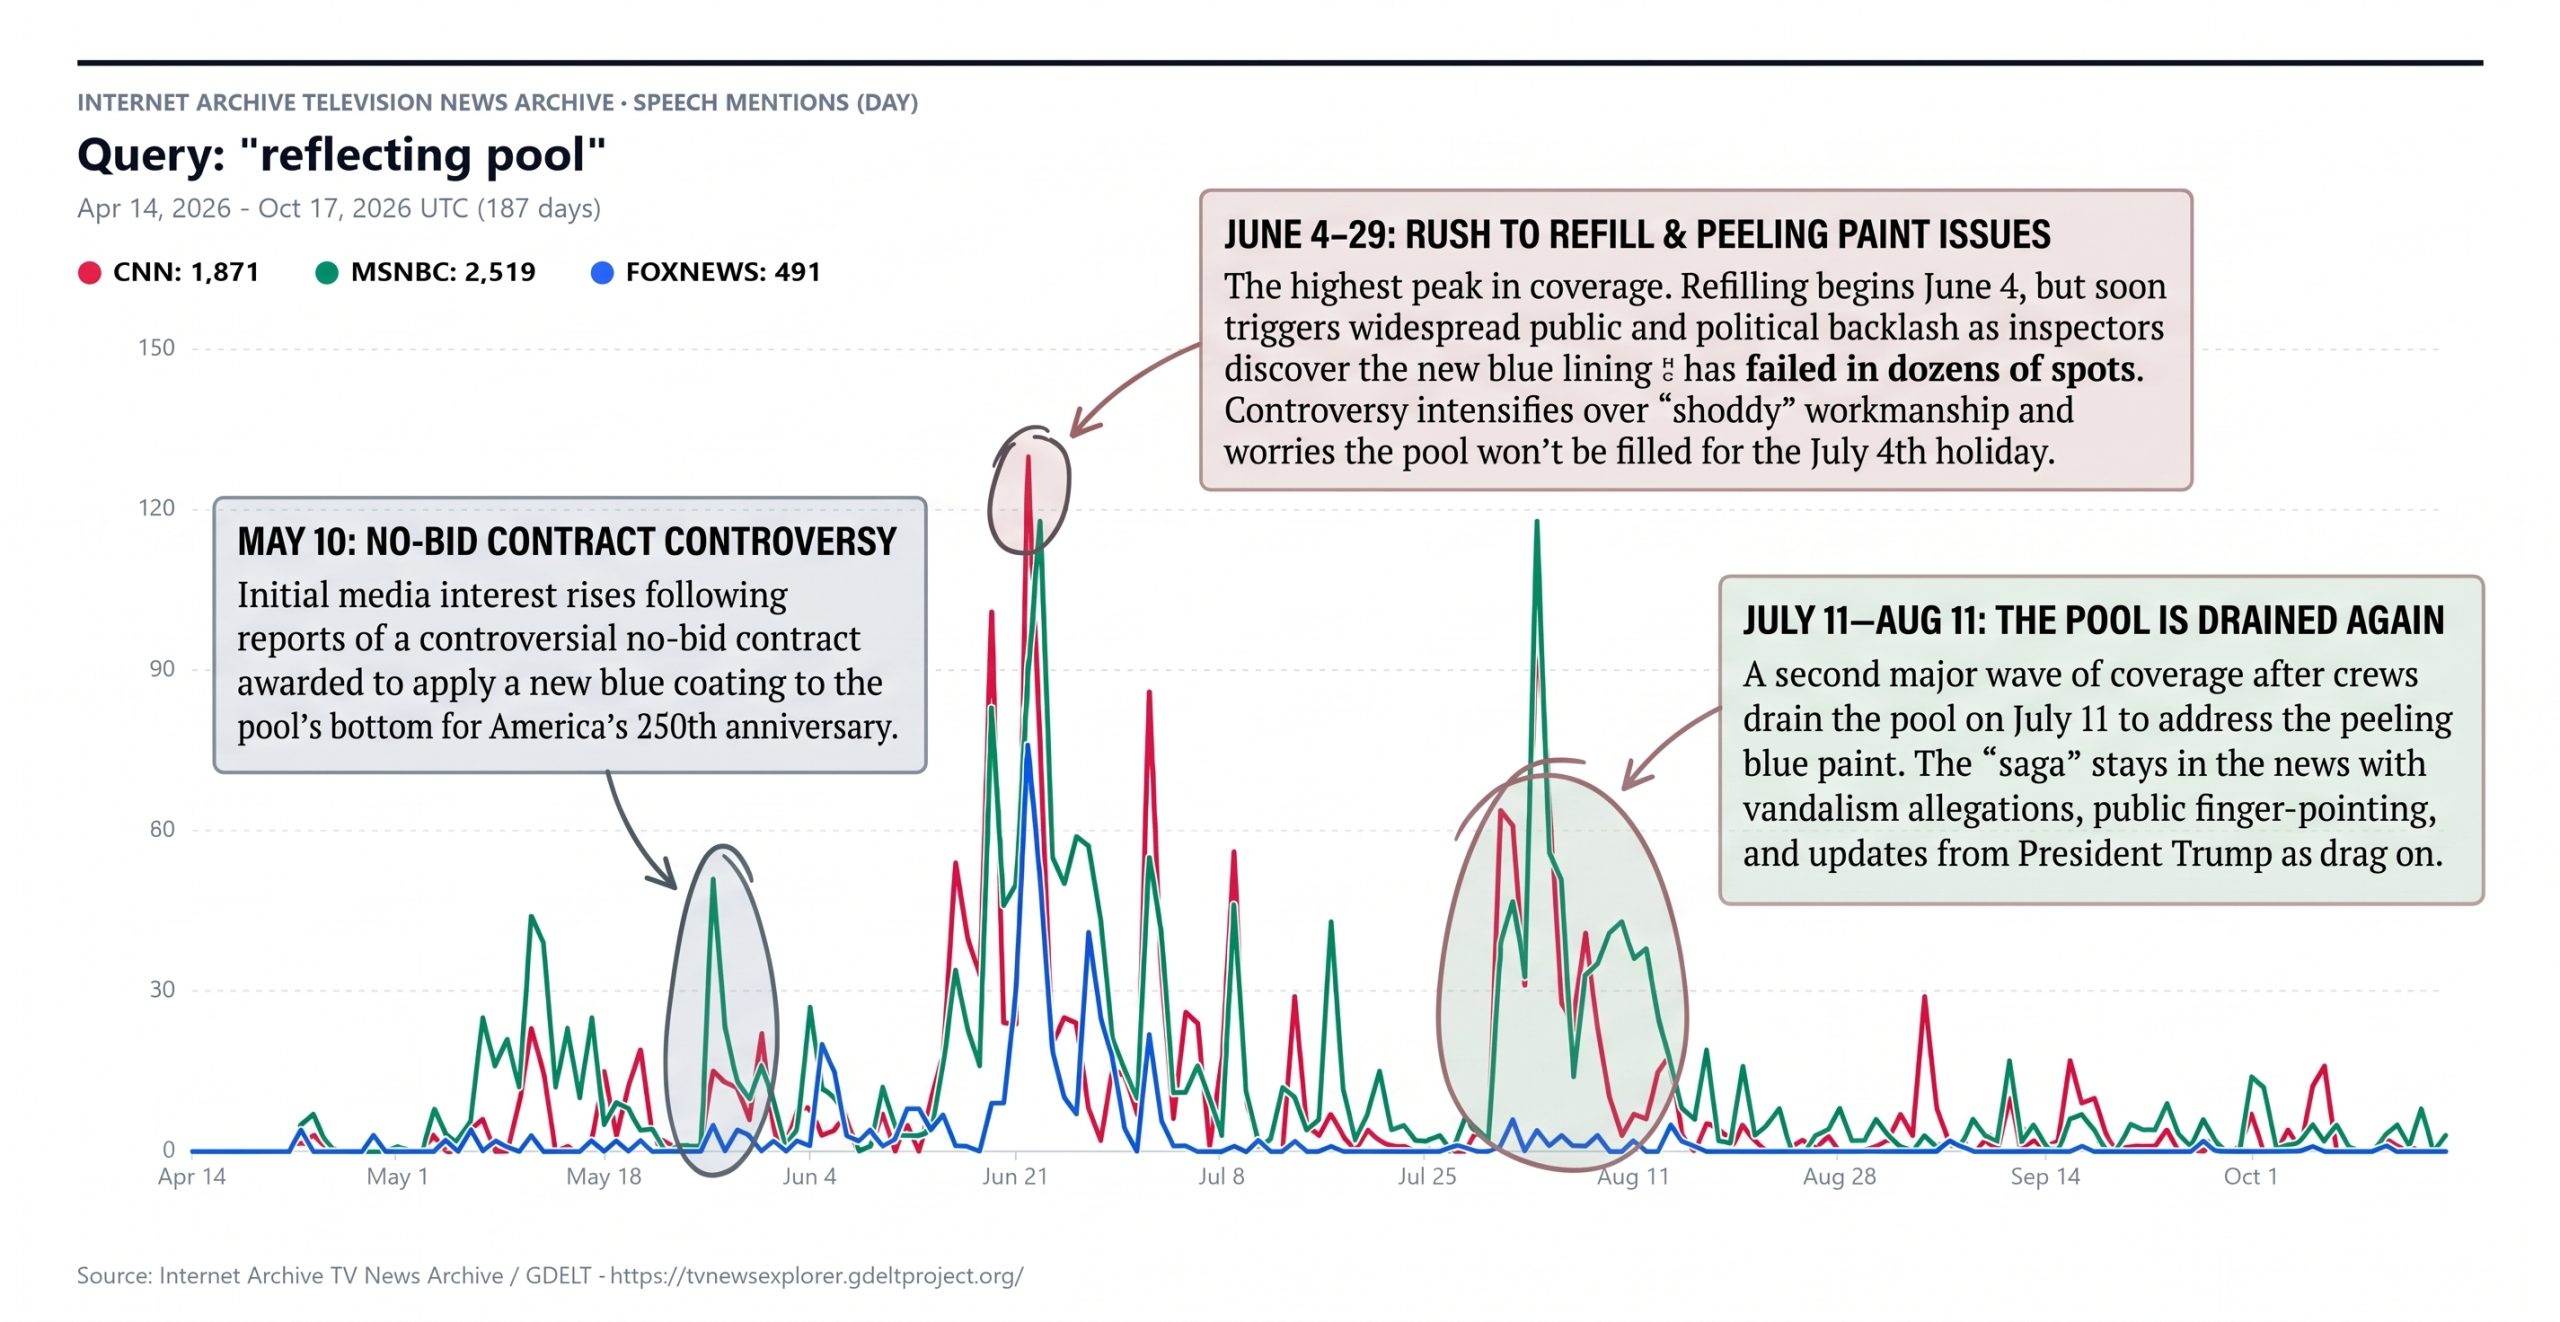
Let's also ask for a textual writeup:
Write a 1-2 paragraph journalistic narrative that explains the major events that drove the sustained surges in this timeline.
Explain ALL of the surges by describing the events that most likely drove them.
Write in prose that could be included in a data journalism news article for a major news outlet.
Yielding:
Between April and October 2026, cable news mentions of the Lincoln Memorial Reflecting Pool transformed what is normally a quiet National Mall landmark into a recurring political flashpoint, generating more than 4,800 total segments across CNN, MSNBC, and Fox News. The coverage first gained sustained momentum in mid-to-late May following investigative reports that the Interior Department had awarded a no-bid contract—ballooning to over $13 million, more than seven times President Trump’s initial $1.8 million estimate—to resurface the basin in "American Flag Blue" ahead of America’s 250th anniversary. That early scrutiny erupted into the timeline's largest sustained wave of coverage between mid-June and mid-July. Shortly after crews rushed to refill the pool in early June, thick green algae bloomed across the water and large sheets of the new blue polyurea coating began peeling off the concrete floor. Media attention hit its highest daily peak around June 21—Exceeding 120 mentions on CNN and nearly matching that on MSNBC—as President Trump blamed the deteriorating liner on sabotage and "vandalism," followed by a series of secondary spikes in early July when federal prosecutors indicted several visitors, including former Olympic canoeist David Hearn, and crews were forced to drain the pool again right after the Fourth of July holiday.
After a brief lull in mid-July, a final sustained surge swept cable broadcasts from late July through mid-August, driven by the sudden collapse of the administration's vandalism narrative. Mention volume spiked back near 120 daily hits on MSNBC in early August when the Justice Department and D.C. U.S. Attorney Jeanine Pirro abruptly dropped the felony charges against Hearn and three other defendants, acknowledging in court filings that a "hasty and botched" contractor installation—rather than vandals—had caused the liner to fail. Coverage remained elevated for nearly two weeks as President Trump publicly rebuked Pirro for dismissing the cases while admitting the renovation had been rushed. Subsequent smaller blips in late August, mid-September, and early October tracked the ongoing fallout, including a judge's permanent dismissal of the criminal cases to prevent prosecutors from refiling charges and the release of a federal failure analysis revealing the blue coating had failed in at least 85 places.