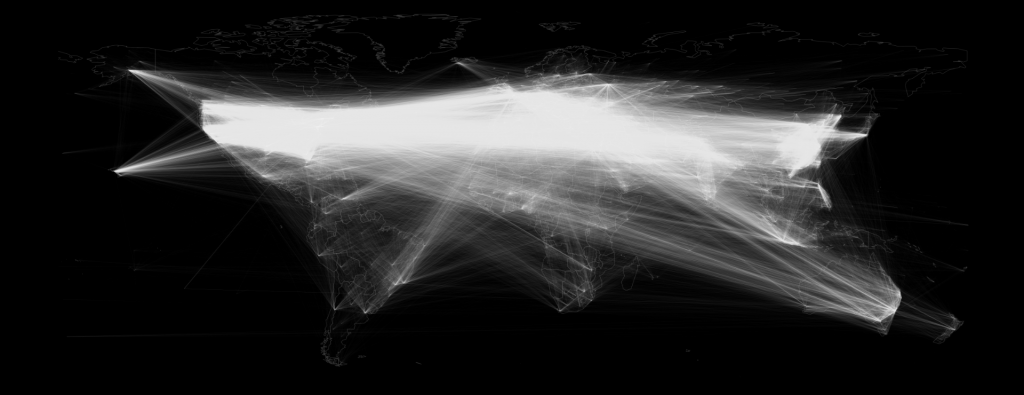
Three years ago we asked what it would look like to create a massive global network visualization that shows how often all of the cities in the world are mentioned together in worldwide news coverage. In other words, when a news article somewhere in the world mentions a given city, what are all of the other cities in the world that are also typically mentioned in that article? Is Paris mentioned more often with Washington, DC than it is Berlin or London? Is Tokyo mentioned more often with Beijing or with New York?
What is the natural geographic clustering of the world's cities and do those relationships have more to do with geography or with political and economic ties?
That final visualization examined nearly 200 million articles covering the entirety of 2015, but with the power of Google BigQuery took just a single line of SQL and 67 seconds to generate.
Fast forward to today and we were curious as to how much that network has changed now that we have almost four full years of data (2015-2018) available. Incredibly, despite processing nearly four times as much data (nearly 850 million news articles and 338GB of geographic data total) and an even greater number of additional permutations, BigQuery took just double the amount of time (110 seconds) to create the final network. In other words, using BigQuery you can now process four times as much data as you could in January 2016 in just double the amount of time – a testament to how fast BigQuery and the underlying Google cloud infrastructure is evolving.
Using just a single line of SQL, more than 6.6 billion geographic references were permuted in realtime to construct a single massive geographic cooccurrence network over the world's cities.
To give you a sense of the incredible scale of this network and how much work BigQuery is doing under the hood, there are just over 25 billion locative cooccurrences recorded in those 6.6 billion geographic mentions across 850 million articles, which BigQuery compiles into the final network structure of 154 million unique pairings of locations on earth in just under two minutes from a single line of SQL. That works out to a sustained performance of more than a quarter billion cooccurrences per second, demonstrating BigQuery's incredible capabilities for network construction and analysis.
Of course, a network this size is too large to visualize – it would yield just a massive spaghetti mess of overlapping lines. Thus, the final network was filtered to retain only those pairs of locations that have been mentioned together across at least 1,000 articles 2015-2018, seen in the image below. The transparency of each line is controlled by how often those cities have been mentioned together – frequently cooccurring cities are displayed as bold lines, while cities that have been mentioned closer to the minimum number of times together are displayed as faint lines.
These transparency settings and cooccurrence thresholds mean that when you look at the map below you will see many areas with only a few connections. That does not mean those cities are not widely mentioned in the media, it only means that they are not mentioned a large number of times with a large number of other cities around the world. If you look closely even very dark areas have some connections.
What can we learn from this network? Overall, while significantly denser than its 2016 counterpart, the overall structure of the network is remarkably similar. The world is seen to largely be covered by the global media as a nexus of the United States, Europe, Asia and the Middle East, with strong regional hubs elsewhere across the world.
Click on the image below to see the medium resolution version (3676 x 1521 pixels @ 4MB). You can also download the full resolution version (16384 x 8192 pixels @ 35MB), though not all browsers are capable of displaying such high resolution images and you may need to open it in Photoshop or other image viewing software to see it.
TECHNICAL DETAILS
The same original workflow and code from 2016 was used to create this new map. The network itself is constructed using BigQuery and then visualized using GraphViz's rasterization engine. A few minor changes were made to the "networkvisualizer.pl" script to adjust how it calculates the edge alpha levels to yield better visibility with the much higher density of edges in the new visualization. If you get resource errors from ImageMagick, run "identify -list resource" to check your currently configured limits. You may need to edit your "/etc/ImageMagick-6/policy.xml" configuration file and change the following settings (the values below are just examples, you should set based on the resources of your current machine and the sizes of images you plan to create):
<policy domain="resource" name="memory" value="2Gib"/>
<policy domain="resource" name="map" value="2Gib"/>
<policy domain="resource" name="width" value="160KP"/>
<policy domain="resource" name="height" value="160KP"/>
<policy domain="resource" name="area" value="2Gib"/>
<policy domain="resource" name="disk" value="2GiB"/>
Here is the final BigQuery SQL command, modified slightly from the 2016 demo to use a higher threshold of 1000 minimum cooccurances:
select Source, Target, Count from (
SELECT a.name Source, b.name Target, COUNT(*) as Count
FROM (FLATTEN(
SELECT GKGRECORDID, CONCAT( STRING(ROUND(FLOAT(IFNULL(REGEXP_EXTRACT(SPLIT(V2Locations,';'),r'^[2-5]#.*?#.*?#.*?#.*?#(.*?)#'), '0')), 3)), '#', STRING(ROUND(FLOAT(IFNULL(REGEXP_EXTRACT(SPLIT(V2Locations,';'),r'^[2-5]#.*?#.*?#.*?#.*?#.*?#(.*?)#'), '0')), 3)) ) AS name
FROM [gdelt-bq:gdeltv2.gkg]
HAVING name != '0.000000#0.000000'
,name)) a
JOIN EACH (
SELECT GKGRECORDID, CONCAT( STRING(ROUND(FLOAT(IFNULL(REGEXP_EXTRACT(SPLIT(V2Locations,';'),r'^[2-5]#.*?#.*?#.*?#.*?#(.*?)#'), '0')), 3)), '#', STRING(ROUND(FLOAT(IFNULL(REGEXP_EXTRACT(SPLIT(V2Locations,';'),r'^[2-5]#.*?#.*?#.*?#.*?#.*?#(.*?)#'), '0')), 3)) ) as name
FROM [gdelt-bq:gdeltv2.gkg]
HAVING name != '0.000000#0.000000'
) b
ON a.GKGRECORDID=b.GKGRECORDID
WHERE a.name<b.name
GROUP EACH BY 1,2
HAVING Count > 1000
ORDER BY 3 DESC
)
