The results of our collaboration with IRIN to explore the effects of media fatigue in coverage of the April 24th, 2015 Nepal earthquake got us interested in whether the two week window of coverage that we observed for Nepal holds for other countries and natural disasters as well. In particular, the global uniformity of how closely the coverage timeline of each country's media system aligned suggests that there may be a generalized global model of media fatigue that holds for all sudden-onset natural disasters.
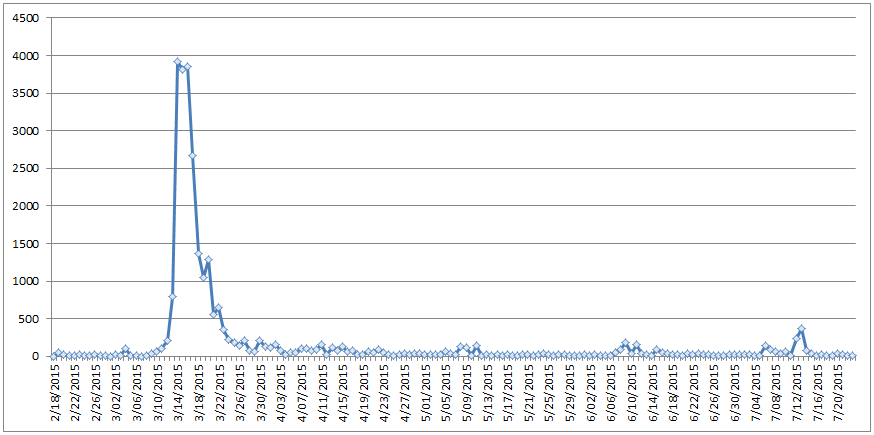
The March 13th, 2015 landfall of Cyclone Pam on Vanuatu offers an ideal comparison point in that, unlike the Nepal earthquake, which struck without warning, there was substantial advanced warning of Cyclone Pam's track, with full knowledge that it would make landfall on Vanuatu at considerable strength. Yet, the timeline below shows total worldwide media coverage volume of Vanuatu by day, showing a nearly identical vertical surge of coverage, followed by an exponential falloff, resulting in approximately two weeks of elevated coverage. Notable in the graph below is the rampup of coverage beginning around March 9th as it became clear that Vanuatu would be affected. As with Nepal, only articles mentioning Vanuatu at least twice were included. In this case the exclusion of casual mentions is especially critical, as without the filter, a surge in coverage is observed April 2nd when a Russian fishing trawler sank in the Sea of Okhotsk with a crew that included citizens from Vanuatu.
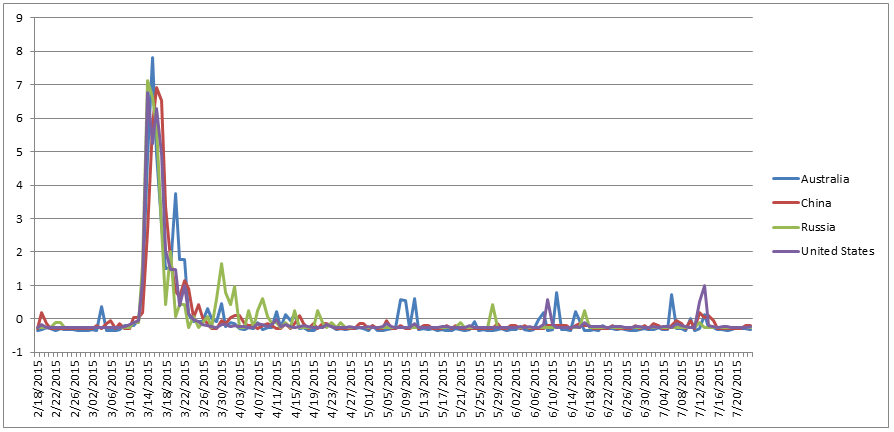
As with the Nepal analysis, the graph below shows the country-level timelines for Australia, China, Russia, and the United States, illustrating that the timeline is effectively identical across countries (Y axis is Z-Score).
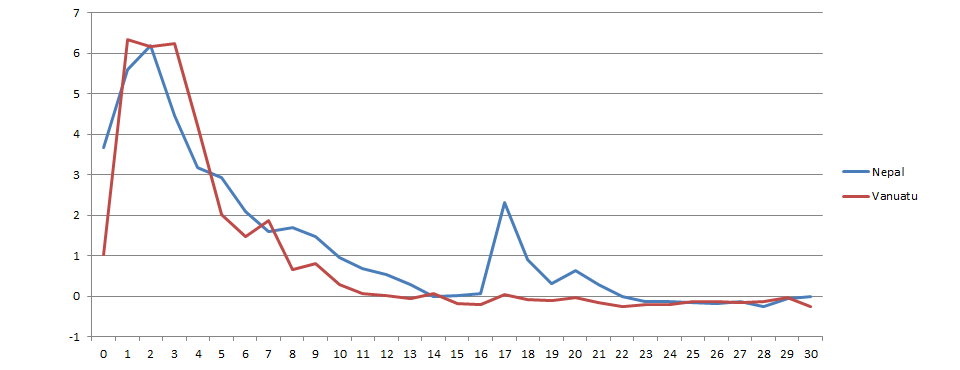
Yet, of greatest interest is the timeline below, which compares the Z-Score values for both Nepal and Vanuatu for the 30 days from the onset of the disaster. Both peak at around 6 standard deviations from mean, before decreasing exponentially and leveling off around 14 days after onset. The only substantial difference between the two timelines is the surge of coverage in Nepal around day 17 representing the second earthquake that occurred there. Even with the second peak in the Nepal timeline, they are correlated at r=0.914, which increases to r=0.960 if only the first 14 days are examined.
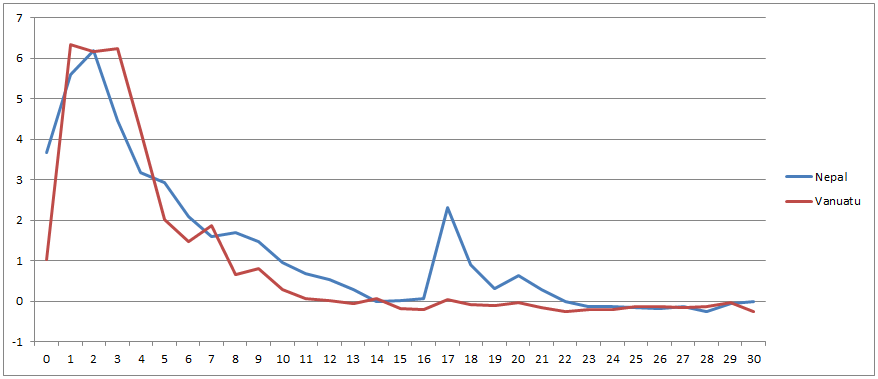
Keep in mind that these are two very different natural disasters, in two different countries, one a sudden-onset earthquake with no prior warning, while the other was expected, with several days of advanced warning. Yet, both not only peak at just over six standard deviations above mean, but exhibit a nearly identical rise-fall and falloff curve. In addition, both disasters had identical timelines across global media systems, indicating that this is a generalized model of media attention and fatigue for natural disasters.
Technical Details
To generate the master global timeline above, we use the copy of GDELT GKG 2.0 housed in Google BigQuery and use the following query to return all of the articles monitored by GDELT that mentioned Nepal at least twice:
SELECT substr(string(DATE), 0, 8) as daydate, count(1) FROM [gdelt-bq:gdeltv2.gkg] WHERE V2Locations like '%Nepal%Nepal%' group by daydate order by daydate asc
Save the results as a CSV file to your computer and graph using a package like Microsoft Excel or R. The per-country timeline above was constructed using the same instructions as the Nepal timeline.
Happy timelining!