Beginning April 22, 2016 GDELT began monitoring all articles for Google AMP HTML and Mobile alternate URLs and recording this in the GKG's "Extra" field. With two months of data now available, we can use this information to map the spread of AMP across the world's news media.
The query below calculates a number of statistics about the GKG in those two months, finding that 37% of monitored articles have AMP versions, 9% have non-AMP mobile versions, 41% have either AMP or mobile or both, 60% were translated from a language other than English, 50% have authorship information available, 53% have extracted hyperlinks and 32% have a precision publication date. The query consumes 21GB and takes just 14.6 seconds.
SELECT count(1) Total,sum(Extras like '%AMP%' or Extras like '%MOBILE%') / count(1) * 100 PercentAMPMobile,
sum(Extras like '%AMP%' ) / count(1) * 100 PercAMP,
sum(Extras like '%MOBILE%') / count(1) * 100 PercMobile,
sum(TranslationInfo is not null)  / count(1) * 100 PercentTranslated,
sum(Extras like '%AUTHORS%') / count(1) * 100 PercentHaveAuthors,
sum(Extras like '%PAGE_LINKS%') / count(1) * 100 PercentHaveLinks,
sum(Extras like '%PRECISE%') / count(1) * 100 PercentHavePrecisePubDate FROM [gdeltv2.gkg] where DATE>=20160422000000;
The query below lets you drill into where these AMP articles are coming from. You specify a country of interest and it tallies the total number of articles published by outlets from that country that advertise an AMP alternate version. Similarly, this query takes just 20GB and 20.9 seconds. For this query, looking at France, we see top outlets like "leparisien.fr" and "20minutes.fr".
select a.SourceCommonName, a.Count, b.CountryName from
( select SourceCommonName, count(1) Count FROM [gdelt-bq:gdeltv2.gkg] where DATE>20160422000000 and Extras like '%PAGE_ALTURL_AMP%' group by SourceCommonName ) a
JOIN EACH ( select Domain, CountryName from [gdelt-bq:extra.sourcesbycountry] ) b
ON a.SourceCommonName = b.Domain having b.CountryName = 'France' order by a.Count desc
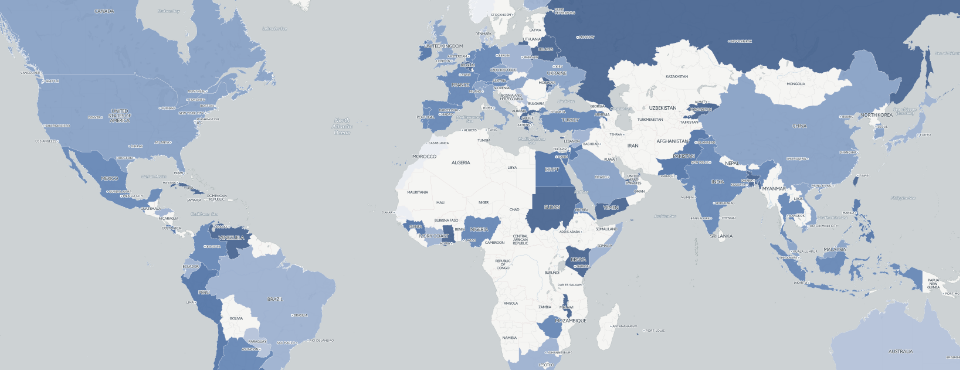
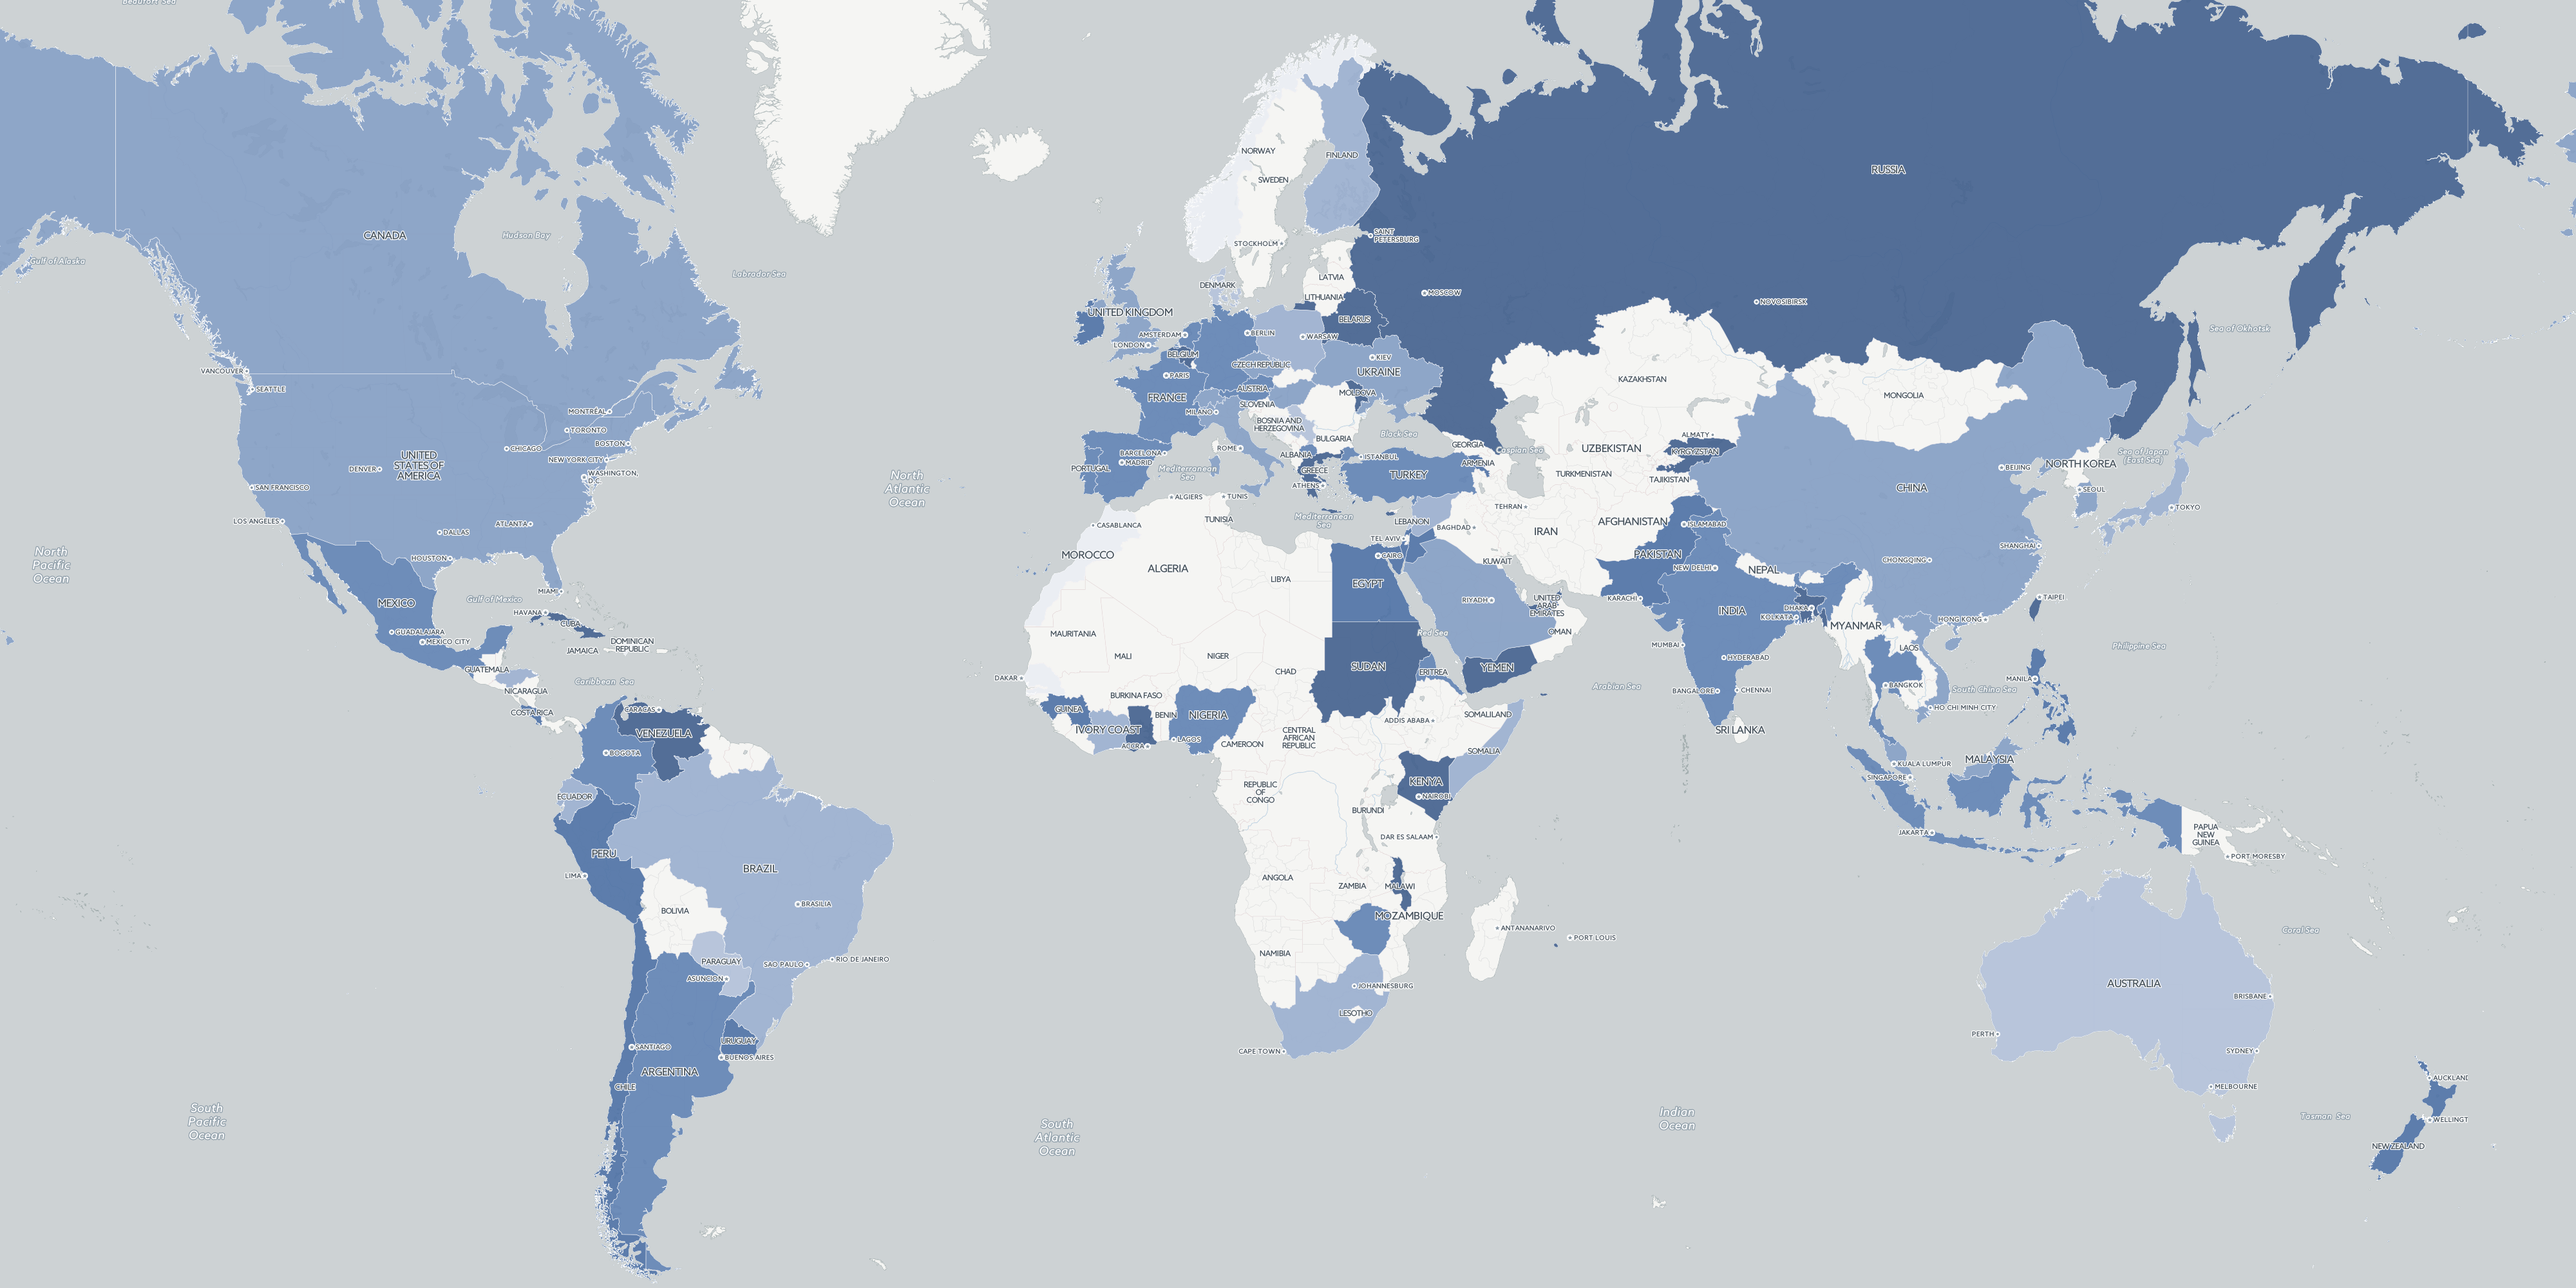
What if we want to aggregate to the country level globally and make a choropleth map that colors each country by the percent of all articles monitored by GDELT over the last two months from outlets in that country that offered an AMP HTML version? The query below completes in just 24.2 seconds and takes just 20GB, yielding a final histogram. Using the query above, one can drill into the results from any given country to see where they are coming from.
select CountryName, Total, AMP, PercAMP from (
select c.CountryName, sum(a.Count) Total, sum(b.Count) AMP, (sum(b.Count) / sum(a.Count) * 100) PercAmp  from
( select SourceCommonName, count(1) Count FROM [gdelt-bq:gdeltv2.gkg] where DATE>20160422000000 group by SourceCommonName ) a
JOIN EACH ( select SourceCommonName, count(1) Count FROM [gdelt-bq:gdeltv2.gkg] where DATE>20160422000000 and Extras like '%PAGE_ALTURL_AMP%' group by SourceCommonName ) b
ON a.SourceCommonName = b.SourceCommonName
JOIN EACH ( select Domain, CountryName from [gdelt-bq:extra.sourcesbycountry] ) c
ON a.SourceCommonName = c.Domain group by c.CountryName order by PercAmp desc
) having Total > 100
Here's the final map produced by the query above after it was imported into CartoDB.
Happy Querying!